If there is one prayer that you should pray/sing every day and every hour, it is the LORD's prayer (Our FATHER in Heaven prayer)
It is the most powerful prayer. A pure heart, a clean mind, and a clear conscience is necessary for it.
- Samuel Dominic Chukwuemeka

For in GOD we live, and move, and have our being. - Acts 17:28

The Joy of a Teacher is the Success of his Students. - Samuel Chukwuemeka


Solved Examples: Measures of Central Tendency

Prerequisite: Introductory Statistics
Calculators:
Vertical Data Entry: Measures of Center
Horizontal Data Entry: Measures of Center

Samuel Dominic Chukwuemeka (SamDom For Peace) For ACT Students
The ACT is a timed exam...$60$ questions for $60$ minutes
This implies that you have to solve each question in one minute.
Some questions will typically take less than a minute a solve.
Some questions will typically take more than a minute to solve.
The goal is to maximize your time. You use the time saved on those questions you solved in less than a minute, to solve the questions that will take more than a minute.
So, you should try to solve each question correctly and timely.
So, it is not just solving a question correctly, but solving it correctly on time.
Please ensure you attempt all ACT questions.
There is no negative penalty for any wrong answer.

For SAT Students
Any question labeled SAT-C is a question that allows a calculator.
Any question labeled SAT-NC is a question that does not allow a calculator.

For JAMB Students
Calculators are not allowed. So, the questions are solved in a way that does not require a calculator.

For WASSCE Students
Any question labeled WASCCE is a question for the WASCCE General Mathematics
Any question labeled WASSCE-FM is a question for the WASSCE Further Mathematics/Elective Mathematics

For NSC Students
For the Questions:
Any space included in a number indicates a comma used to separate digits...separating multiples of three digits from behind.
Any comma included in a number indicates a decimal point.
For the Solutions:
Decimals are used appropriately rather than commas
Commas are used to separate digits appropriately.

Solve all questions.
Show all work.
(1.) ACT To determine a student's overall test score for the semester, Ms. Ackerman deletes the lowest test score and calculates the average of the remaining test scores.
Niels took all 5 tests and earned the following test scores in Ms. Ackerman's class this semester: 62, 78, 83, 86, and 93.
What overall test score did Niels earn in Ms. Ackerman's class this semester?

$ A.\:\: 77.5 \\[3ex] B.\:\: 80.4 \\[3ex] C.\:\: 83.4 \\[3ex] D.\:\: 85.0 \\[3ex] E.\:\: 85.5 \\[3ex] $

$ Lowest\:\:score = 62 \\[3ex] Delete\:\: 62 \\[3ex] Average\:\:of\:\:remaining\:\:scores = \dfrac{78 + 83 + 86 + 93}{4} = \dfrac{340}{4} = 85 \\[5ex] \therefore Overall\:\:test\:\:score = 85.0 $
(2.) JAMB Find the mean of the following 24.57, 25.63, 25.32, 26.01, 25.77

$ A.\:\: 25.12 \\[3ex] B.\:\: 25.30 \\[3ex] C.\:\: 25.46 \\[3ex] D.\:\: 25.50 \\[3ex] E.\:\: 25.73 \\[3ex] $

$ x = 24.57, 25.63, 25.32, 26.01, 25.77 \\[3ex] \Sigma x = 24.57 + 25.63 + 25.32 + 26.01 + 25.77 \\[3ex] \Sigma x = 127.3 \\[3ex] n = 5 \\[3ex] \bar{x} = \dfrac{\Sigma x}{n} \\[5ex] \bar{x} = \dfrac{127.3}{5} \\[5ex] \bar{x} = 25.46 $
(3.) ACT A certain group consists of 5 children, 3 of whom are age 10 and 2 of whom are age 5.
What is the mean age of the children in the group?

$ A.\:\: 5 \\[3ex] B.\:\: 7 \\[3ex] C.\:\: 7.5 \\[3ex] D.\:\: 8 \\[3ex] E.\:\: 10 \\[3ex] $

$ 3\:\:children\:\:aged\:\:10 = 10, 10, 10 \\[3ex] 2\:\:children\:\:aged\:\:5 = 5, 5 \\[3ex] x = Ages = 10, 10, 10, 5, 5 \\[3ex] \Sigma x = 10 + 10 + 10 + 5 + 5 \\[3ex] \Sigma x = 40 \\[3ex] n = 5 \\[3ex] \bar{x} = \dfrac{\Sigma x}{n} \\[5ex] \bar{x} = \dfrac{40}{5} \\[5ex] \bar{x} = 8 $
(4.) JAMB Find the median of 2, 3, 7, 3, 4, 5, 8, 9, 9, 4, 5, 3, 4, 2, 4 and 5

$ A.\:\: 9 \\[1em] B.\:\: 8 \\[1em] C.\:\: 7 \\[1em] D.\:\: 4 \\[1em] $

$ x = 2, 3, 7, 3, 4, 5, 8, 9, 9, 4, 5, 3, 4, 2, 4, 5 \\[1em] Sort\:\:in:\:ascending\:\:order \\[1em] x = 2, 2, 3, 3, 3, 4, 4, 4, 4, 5, 5, 5, 7, 8, 9, 9 \\[1em] \tilde{x} = \dfrac{4 + 4}{2} \\[2em] \tilde{x} = \dfrac{8}{2} \\[2em] \tilde{x} = 2 $
(5.) JAMB Thirty boys and x girls sat for a test.
The mean of the boys' scores and that of the girls were respectively 6 and 8
Find x if the total score was 468

$ A.\:\: 38 \\[3ex] B.\:\: 24 \\[3ex] C.\:\: 36 \\[3ex] D.\:\: 22 \\[3ex] E.\:\: 41 \\[3ex] $

$ \bar{x} = \dfrac{\Sigma x}{n} \\[5ex] \Sigma x = \bar{x} * n \\[3ex] \underline{Boys} \\[3ex] n = 30 \\[3ex] \bar{x} = 6 \\[3ex] \Sigma x = 6(30) \\[3ex] \Sigma x = 180 \\[3ex] \underline{Girls} \\[3ex] n = x \\[3ex] \bar{x} = 8 \\[3ex] \Sigma x = 8(x) = 8x \\[3ex] \underline{Boys\:\:and\:\:Girls} \\[3ex] \Sigma x = 468 \\[3ex] 180 + 8x = 468 \\[3ex] 8x = 468 - 180 \\[3ex] 8x = 288 \\[3ex] x = \dfrac{288}{8} \\[5ex] x = 36 \\[3ex] $ There were $36$ girls
(6.) ACT What is the product of the mean and median of the first 6 prime numbers?
(Note: 2 is the first prime number.)

$ A.\:\: 27 \\[3ex] B.\:\: 37 \\[3ex] C.\:\: 39 \\[3ex] D.\:\: 41 \\[3ex] E.\:\: 42 \\[3ex] $

$ The\:\:first\:\:6\:\:prime\:\:numbers\:\:are\:\: 2, 3, 5, 7, 11, 13 \\[3ex] Mean = \dfrac{2 + 3 + 5 + 7 + 11 + 13}{6} = \dfrac{41}{6} \\[5ex] Median = \dfrac{5 + 7}{2} = \dfrac{12}{2} = 6 \\[5ex] Mean * Median = \dfrac{41}{6} * 6 = 41 $
(7.) At the end of the second semester, Rita earned an A in the 4-credit Algebra course, a B in the 3-credit English course, a B in the 4-credit Biology course, an A in the 4-credit Chemistry course, and a C in the 1-credit Chinese Language course.
Using a 4-point grade system, A is equivalent to 4 points, B is equivalent to 3 points, C is equivalent to 2 points, D is equivalent to 1 point, and F has no point.
Calculate Rita's grade point average (GPA) for the second semester.


Let us represent this information in a table.
Course Grade Point Credit Hour (CH) Grade Point, (GP) = Point * Credit Hour
Algebra $A$ $4$ $4$ $4 * 4 = 16$
English $B$ $3$ $3$ $3 * 3 = 9$
Biology $B$ $3$ $4$ $3 * 4 = 12$
Chemistry $A$ $4$ $4$ $4 * 4 = 16$
Chinese $C$ $2$ $1$ $2 * 1 = 2$
$\Sigma CH = 16$ $\Sigma GP = 55$


$ GPA = \dfrac{\Sigma GP}{\Sigma CH} \\[5ex] GPA = \dfrac{55}{16} \\[5ex] GPA = 3.4375 \\[3ex] GPA \approx 3.44 $
(8.) Based on Question (7).
Rita had a GPA of approximately 3.58 (actual GPA = 3.583333333) during the first semester when she took 12-credit hours.
Calculate her cumulative grade point average (CGPA) for the year (for both first and second semesters)


$ \underline{First\:\:Semester} \\[3ex] \Sigma CH = 12 \\[3ex] GPA = 3.583333333 \\[3ex] \Sigma GP = 3.583333333(12) = 43 \\[3ex] \underline{Second\:\:Semester} \\[3ex] \Sigma CH = 16 \\[3ex] \Sigma GP = 55 \\[3ex] \underline{First\:\:and\:\:Second\:\:Semesters} \\[3ex] \Sigma CH = 12 + 16 = 28 \\[3ex] \Sigma GP = 43 + 55 = 98 \\[3ex] CGPA = \dfrac{\Sigma GP}{\Sigma CH} \\[5ex] CGPA = \dfrac{98}{28} \\[5ex] CGPA = 3.5 \\[3ex] CGPA = 3.50 $
(9.) JAMB Use the table below to answer the questions.

Marks $1$ $2$ $3$ $4$ $5$
Frequencies $2$ $2$ $8$ $4$ $4$

How many students took the test?

$ A.\:\: 16 \\[3ex] B.\:\: 20 \\[3ex] C.\:\: 13 \\[3ex] D.\:\: 15 \\[3ex] $ Find the mean mark.

$ A.\:\: 3.1 \\[3ex] B.\:\: 3.0 \\[3ex] C.\:\: 3.3 \\[3ex] D.\:\: 3.2 \\[3ex] $

Marks, $x$ Frequencies, $f$ $f * x$
$1$ $2$ $2$
$2$ $2$ $4$
$3$ $8$ $24$
$4$ $4$ $16$
$5$ $4$ $20$
$\Sigma f = 20$ $\Sigma fx = 66$

$20$ students took the test

$ \bar{x} = \dfrac{\Sigma fx}{\Sigma f} \\[5ex] \bar{x} = \dfrac{66}{20} = \dfrac{33}{10} \\[5ex] \bar{x} = 3.3 $
(10.) ACT For $20$ quiz scores in a typing class, the table below gives the frequency of the scores in each score interval.
Which score interval contains the median of the scores?

Score interval Frequency
$96-100$ $3$
$91-95$ $1$
$86-90$ $3$
$81-85$ $4$
$76-80$ $9$

$ A.\:\: 96-100 \\[3ex] B.\:\: 91-95 \\[3ex] C.\:\: 96-90 \\[3ex] D.\:\: 81-85 \\[3ex] E.\:\: 76-80 \\[3ex] $

$ \Sigma f = 3 + 1 + 3 + 4 + 9 = 20 \\[3ex] \dfrac{\Sigma f}{2} = \dfrac{20}{2} = 10 \\[5ex] Begin\:\:from\:\:the\:\:first\:\:class \\[3ex] Keep\:\:adding\:\:the\:\:frequencies\:\:till\:\:you\:\:get\:\:to\:\:10 \\[3ex] 3 + 1 = 4 \\[3ex] 4 + 3 = 7 \\[3ex] 7 + 4 = 11...stop \\[3ex] $ The class that contains the median is $81-85$
(11.) WASCCE If the mean of the numbers $5, 8, x, 12, (x + 5)\:\:and\:\:10\:\:is\:\:10$, find $x$

$ A.\:\: 6 \\[3ex] B.\:\: 8 \\[3ex] C.\:\: 10 \\[3ex] D.\:\: 60 \\[3ex] $

$ \Sigma x = 5 + 8 + x + 12 + (x + 5) + 10 \\[3ex] \Sigma x = 35 + x + x + 5 \\[3ex] \Sigma x = 40 + 2x \\[3ex] n = 6 \\[3ex] \bar{x} = 10 \\[3ex] \bar{x} = \dfrac{\Sigma x}{n} \\[5ex] \rightarrow \Sigma x = \bar{x} * n \\[3ex] 40 + 2x = 10(6) \\[3ex] 40 + 2x = 60 \\[3ex] 2x = 60 - 40 \\[3ex] 2x = 20 \\[3ex] x = \dfrac{20}{2} \\[5ex] x = 10 \\[3ex] \underline{Check} \\[3ex] x = 10 \\[3ex] x + 5 = 10 + 5 = 15 \\[3ex] Data\:\:values = 5, 8, 10, 12, 15, 10 \\[3ex] \Sigma x = 5 + 8 + 10 + 12 + 15 + 10 = 60 \\[3ex] n = 6 \\[3ex] \bar{x} = \dfrac{\Sigma x}{n} \\[5ex] \bar{x} = \dfrac{60}{6} \\[5ex] \bar{x} = 10 $
(12.) A nurse recorded the weights of 2 patients in a hospital.
She noticed that one of the weights she recorded was not clear.
She wanted to re-record but all the patients were discharged.
Assume the mean score of the weights is 82 and the mean of the 19 readable weights is 86, what is the value of the unreadable weight?


Let the unreadable weight = $x$

$ For\:\:20\:\:patients \\[3ex] \bar{x} = 82 \\[3ex] n = 20 \\[3ex] \bar{x} = \dfrac{\Sigma x}{n} \\[5ex] \rightarrow \Sigma x = \bar{x} * n \\[3ex] \Sigma x = 82(20) = 1640 \\[3ex] For\:\:19\:\:patients \\[3ex] \bar{x} = 86 \\[3ex] n = 19 \\[3ex] \Sigma x = \bar{x} * n \\[3ex] \Sigma x = 86(19) = 1634 \\[3ex] \Sigma x_{19} + x = \Sigma x_{20} \\[3ex] 1634 + x = 1640 \\[3ex] x = 1640 - 1634 \\[3ex] x = 6 $
(13.) JAMB Find the mean of the data 7, −3, 4, −2, 5, −9, 4, 8, −6, 12

$ A.\:\: 4 \\[1em] B.\:\: 3 \\[1em] C.\:\: 2 \\[1em] D.\:\: 1 \\[1em] $

$ x = 7, -3, 4, -2, 5, -9, 4, 8, -6, 12 \\[3ex] \Sigma x = 7 + -3 + 4 + -2 + 5 + -9 + 4 + 8 + -6 + 12 \\[3ex] \Sigma x = 7 - 3 + 4 - 2 + 5 - 9 + 4 + 8 - 6 + 12 \\[3ex] \Sigma x = 20 \\[3ex] n = 10 \\[3ex] \bar{x} = \dfrac{\Sigma x}{n} \\[5ex] \bar{x} = \dfrac{20}{10} \\[5ex] \bar{x} = 2 $
(14.) The retirement ages (in years) of nine employees of the town of Scrabble, West Virginia are:
51, 61, 62, 57, 50, 67, 68, 58, 53
Determine the mode.


Data Value Frequency
$51$ $1$
$61$ $1$
$62$ $1$
$57$ $1$
$50$ $1$
$67$ $1$
$68$ $1$
$58$ $1$
$53$ $1$

There is no mode.

(15.) CSEC (a) The information below represents the minimum temperatures, in °C, recorded in Country A for the first 20 days in a particular month.

21 23 25 22 24 25 23 26 23 24
25 26 23 25 23 25 24 25 25 25

(i) Complete the frequency table below, using the information above.

Temperature ($^\circ C$) Tally Frequency
$21$ I $1$
$22$ I $1$
$23$
$24$ III $3$
$25$
$26$

(ii) Determine the median temperature.

(iii) Calculate the mean temperature for the twenty-day period.


(i) The completed frequency table is:
Temperature, $x$ ($^\circ C$) Tally Frequency, $f$ $f * x$
$21$ I $1$ $21$
$22$ I $1$ $22$
$23$ IIII $5$ $115$
$24$ III $3$ $72$
$25$ IIII III $8$ $200$
$26$ II $2$ $52$
$\Sigma f = 20$ $\Sigma fx = 482$

$ \Sigma f = 1 + 1 + 5 + 3 + 8 + 2 = 20 \\[3ex] An\:\:even\:\:sample\:\:size\:\:means\:\:two\:\:middle\:\:numbers \\[3ex] \dfrac{\Sigma f}{2} = \dfrac{20}{2} = 10 \\[5ex] Begin\:\:from\:\:the\:\:first\:\:temperature \\[3ex] Keep\:\:adding\:\:the\:\:frequencies\:\:till\:\:you\:\:get\:\:to\:\:10 \\[3ex] 1 + 1 = 2 \\[3ex] 2 + 5 = 7 \\[3ex] 7 + 3 = 10...stop \\[3ex] $ The temperature that contains that $10$ is $24$

$ Begin\:\:from\:\:the\:\:last\:\:temperature \\[3ex] Keep\:\:adding\:\:the\:\:frequencies\:\:till\:\:you\:\:get\:\:to\:\:10 \\[3ex] 2 + 8 = 10...stop \\[3ex] $ The temperature that contains that $10$ is $25$
This implies that the two middle numbers are $24$ and $25$

$ \therefore \tilde{x} = \dfrac{24 + 25}{2} \\[5ex] \tilde{x} = \dfrac{49}{2} \\[5ex] \tilde{x} = 24.5 \\[3ex] $ (ii) The median temperature is $24.5^\circ C$

$ \bar{x} = \dfrac{\Sigma fx}{\Sigma f} \\[5ex] \bar{x} = \dfrac{482}{20} \\[5ex] \bar{x} = 24.1 \\[3ex] $ (iii) The mean temperature is $24.1^\circ C$

(16.) The ages of the 2016 United States Presidential candidates from 4 political parties are:

70 64 45 45 65 63 66 54 62 58
53 61 71 61 45 48 66 53 63 70
55 68 75 65 63

Calculate the measures of central tendency of the data set.


To make it easier (as I did in the video),
Mark the $45-s$ with red circles
Mark the $48-s$ with red check marks
Mark the $53-s$ with red squares
Mark the $54-s$ with red triangles
Mark the $55-s$ with red hexagons
Mark the $58-s$ with white circles
Mark the $61-s$ with white triangles
Mark the $62-s$ with white squares
Mark the $63-s$ with white check marks
Mark the $64-s$ with white hexagons
Mark the $65-s$ with blue check marks
Mark the $66-s$ with blue circles
Mark the $68-s$ with blue squares
Mark the $70-s$ with blue triangles
Mark the $71-s$ if you wish
Mark the $75-s$ if you wish

Ages, $x$ Frequency, $f$ $f * x$
$45$ $3$ $135$
$48$ $1$ $48$
$53$ $2$ $106$
$54$ $1$ $54$
$55$ $1$ $55$
$58$ $1$ $58$
$61$ $2$ $122$
$62$ $1$ $62$
$63$ $3$ $189$
$64$ $1$ $64$
$65$ $2$ $130$
$66$ $2$ $132$
$68$ $1$ $68$
$70$ $2$ $140$
$71$ $1$ $71$
$75$ $1$ $75$
$\Sigma f = 25$ $\Sigma fx = 1509$

$ \bar{x} = \dfrac{\Sigma fx}{\Sigma f} \\[5ex] \bar{x} = \dfrac{1509}{25} \\[5ex] \bar{x} = 60.36 \\[3ex] $ The mean age is $60.36$ years

$ \Sigma f = 25 \\[3ex] An\:\:odd\:\:sample\:\:size\:\:means\:\:only\:\:one\:\:middle\:\:number \\[3ex] \dfrac{\Sigma f}{2} = \dfrac{25}{2} = 12.5 \\[5ex] Begin\:\:from\:\:the\:\:first\:\:age \\[3ex] Keep\:\:adding\:\:the\:\:frequencies\:\:till\:\:you\:\:get\:\:to\:\:12.5 \\[3ex] 3 + 1 = 4 \\[3ex] 4 + 2 = 6 \\[3ex] 6 + 1 = 7 \\[3ex] 7 + 1 = 8 \\[3ex] 8 + 1 = 9 \\[3ex] 9 + 2 = 11 \\[3ex] 11 + 1 = 12 \\[3ex] 12 + 3 = 15...stop \\[3ex] $ The age that contains that $12.5$ is $63$
The median age is $63$ years

Highest Frequency = $3$
The ages with the highest frequency are $45$ and $63$
Technically, this is a bimodal data ... it has two modes
However, looking at the values of the mean and median;
The "actual" modal age is $63$ years

$ x_{MR} = \dfrac{min + max}{2} \\[5ex] min = 45 \\[3ex] max = 75 \\[3ex] \rightarrow x_{MR} = \dfrac{45 + 75}{2} \\[5ex] x_{MR} = \dfrac{120}{2} \\[5ex] x_{MR} = 60 \\[3ex] $ The midrange age is $60$ years
(17.) CMAT Students in a commerce class took a test.
The average score of men is 70 and of women is 83.
The class average is 76.
What is the ratio of men to women in the class?

$ 1.\:\: 8:7 \\[3ex] 2.\:\: 7:8 \\[3ex] 3.\:\: 7:6 \\[3ex] 4.\:\: 6:7 \\[3ex] $

$ \bar{x} = \dfrac{\Sigma x}{n} \\[5ex] \rightarrow \Sigma x = \bar{x} * n \\[3ex] \underline{Men} \\[3ex] n_m = ? \\[3ex] \bar{x}_m = 70 \\[3ex] \Sigma x_m = \bar{x}_m * n_m \\[3ex] \Sigma x_m = 70 * n_m \\[3ex] \underline{Women} \\[3ex] n_w = ? \\[3ex] \bar{x}_w = 83 \\[3ex] \Sigma x_w = \bar{x}_w * n_w \\[3ex] \Sigma x_w = 83 * n_w \\[3ex] \underline{Entire\:\:Class - Both\:\:Men\:\:and\:\:Women} \\[3ex] n_m + n_w = ? \\[3ex] \bar{x}_{mw} = 76 \\[3ex] \Sigma x_{mw} = \bar{x}_{mw} * (n_m + n_w) \\[3ex] \Sigma x_{mw} = 76 * (n_m + n_w) \\[3ex] $ The summation of the scores of the class (men and women) is equal to the sum of the summation of the scores of the men and the summation of the scores of the women.

$ \therefore 76(n_m + n_w) = 70n_m + 83n_w \\[3ex] 76n_m + 76n_w = 70n_m + 83n_w \\[3ex] 76n_m - 70n_m = 83n_w - 76n_w \\[3ex] 6n_m = 7n_w \\[3ex] \dfrac{n_m}{n_w} = \dfrac{7}{6} $
(18.) JAMB By how much is the mean of 30, 56, 31, 55, 43, and 44 less than the median?

$ A.\:\: 0.50 \\[3ex] B.\:\: 0.33 \\[3ex] C.\:\: 0.17 \\[3ex] D.\:\: 0.75 \\[3ex] $

The data set sorted in ascending order is $30, 31, 43, 44, 55, 56$

$ \bar{x} = \dfrac{30 + 31 + 43 + 44 + 55 + 56}{6} = \dfrac{259}{6} \\[5ex] \tilde{x} = \dfrac{43 + 44}{2} = \dfrac{87}{2} \\[5ex] Mean\:\:less\:\:than\:\:Median\:\:means\:\:Median - Mean \\[3ex] \tilde{x} - \bar{x} = \dfrac{87}{2} - \dfrac{259}{6} \\[5ex] = \dfrac{261}{6} - \dfrac{259}{6} \\[5ex] = \dfrac{261 - 259}{6} \\[5ex] = \dfrac{2}{6} \\[5ex] = \dfrac{1}{3} \approx 0.33 $
(19.) WASSCE-FM In a Physics examination, the mean mark of the first twelve students in a class is 60, that of the next twenty students is 50 and that of the remaining y students is x. What is the mean mark for the whole class in the examination, in terms of x and y?


$ \bar{x} = \dfrac{\Sigma x}{n} \\[5ex] \rightarrow \Sigma x = n * \bar{x} \\[3ex] \underline{First\:\:12\:\:students} \\[3ex] n = 12 \\[3ex] \bar{x} = 60 \\[3ex] \Sigma x = 12 * 60 = 720 \\[3ex] \underline{Next\:\:Twenty\:\:students} \\[3ex] n = 20 \\[3ex] \bar{x} = 50 \\[3ex] \Sigma x = 20 * 50 = 1000 \\[3ex] \underline{Remaining\:\:y\:\:students} \\[3ex] n = y \\[3ex] \bar{x} = x \\[3ex] \Sigma x = y * x = xy \\[3ex] \underline{Whole\:\:Class} \\[3ex] n = 12 + 20 + y = 32 + y \\[3ex] \Sigma x = 720 + 1000 + xy = 1720 + xy \\[3ex] \bar{x} = \dfrac{1720 + xy}{32 + y} \\[5ex] \bar{x} = \dfrac{xy + 1720}{y + 32} $
(20.) ACT The 5 positive integers x, x, x, y, and z have an average of x
Which of the following equations must be true?

$ A.\:\: y = -z \\[3ex] B.\:\: y = z \\[3ex] C.\:\: y + z = 0 \\[3ex] D.\:\: y + z = x \\[3ex] E.\:\: y + z = 2x \\[3ex] $

$ \Sigma x = x + x + x + y + z = 3x + y + z \\[3ex] n = 5 \\[3ex] \bar{x} = \dfrac{\Sigma x}{n} \\[5ex] \bar{x} = x \\[3ex] \rightarrow x = \dfrac{3x + y + z}{5} \\[5ex] Cross\:\:Multiply \\[3ex] 5x = 3x + y + z \\[3ex] 5x - 3x = y + z \\[3ex] 2x = y + z \\[3ex] y + z = 2x $


Top


(21.) WASSCE The marks scored by 50 students in a Geography examination are as follows:
60 50 40 67 53 73 37 55 62 43
44 69 39 32 45 58 48 67 39 51
46 59 40 52 61 48 23 60 59 47
65 58 74 47 40 59 68 51 50 50
71 51 26 36 38 70 46 40 51 42

(a) Using class intervals $21-30, 31-40...$, prepare a frequency distribution table.

(b) Calculate the mean mark of the distribution.

(c) What percentage of the students scored more than $60$?


$ minimum = 23 \\[3ex] maximum = 74 \\[3ex] $ To make it easier,
Draw the table with the class intervals and tally first
Begin from the first column (not the first row because it is easier to deal with the data values with the way it is arranged in columns)
Place tallies as you read the data values from top to bottom
Then, draw the frequency column and add the frequencies
Check to make sure the sum of the frequencies is $50$

OR

Mark the $21-30$ with triangles
Mark the $31-40$ with squares
Mark the $41-50$ with circles
Mark the $51-60$ with $X's$
Mark the $61-70$ with check marks
Mark the $71-80$ if you wish

Marks, $x$ Tally Frequency, $f$ $x_{mid} = \dfrac{LCI + UCI}{2}$ $f * x_{mid}$
$21-30$ II $2$ $\dfrac{21 + 30}{2} = \dfrac{51}{2} = 25.5$ $51$
$31-40$ IIII IIII $10$ $\dfrac{31 + 40}{2} = \dfrac{71}{2} = 35.5$ $355$
$41-50$ IIII IIII III $12$ $\dfrac{41 + 50}{2} = \dfrac{91}{2} = 45.5$ $546$
$51-60$ IIII IIII IIII $15$ $\dfrac{51 + 60}{2} = \dfrac{111}{2} = 55.5$ $832.5$
$61-70$ IIII III $8$ $\dfrac{61 + 70}{2} = \dfrac{131}{2} = 65.5$ $524$
$71-80$ III $3$ $\dfrac{71 + 80}{2} = \dfrac{151}{2} = 75.5$ $226.5$
$\Sigma f = 50$ $\Sigma fx_{mid} = 2535$

$ (b) \\[1em] \bar{x} = \dfrac{\Sigma fx_{mid}}{\Sigma f} \\[5ex] \bar{x} = \dfrac{2535}{50} \\[5ex] \bar{x} = 50.7 \\[3ex] (c) \\[1em] More\:\:than\:\:60\:\:means\:\: 61-70\:\:and\:\:71-80 \\[3ex] Number\:\:of\:\:students\:\:who\:\:scored\:\:more\:\:than\:\:60 = 8 + 3 = 11 \\[3ex] Total\:\:number\:\:of\:\:students = \Sigma f = 50 \\[3ex] \therefore Percentage\:\:of\:\:students\:\:who\:\:scored\:\:more\:\:than\:\:60 = \dfrac{11}{50} * 100 \\[5ex] = 11 * 2 \\[3ex] = 22\% $
(22.) CSEC A class of 30 students counted the number of books in their bags on a certain day. The number of books in EACH bag is shown below.
5 4 6 3 2 1 7 4 5 3
6 5 4 3 7 6 2 5 4 5
5 7 5 4 3 2 1 6 3 4

(a) Copy and complete the frequency table for the data shown above.

Number of Books $(x)$ Tally Frequency $(f)$ $f * x$
$1$ II $2$ $2$
$2$ III $3$ $6$
$3$ $...$ $...$
$4$ $...$ $...$
$5$ $...$ $...$
$6$ $...$ $...$
$7$ $...$ $...$

(b) State the modal number of books in the bags of the sample of students.

(c) Using the table in (a) above, or otherwise, calculate
(i) the TOTAL number of books
(ii) the mean number of books per bag.

(d) Determine the probability that a student chosen at random has LESS THAN $4$ books in his/her bag.


To make it easier,
Draw the table with the class intervals and tally first
Just begin with a clean table: table with no prior entries.
Begin from the first column (not the first row because it is easier to deal with the data values with the way it is arranged in columns)
Place tallies as you read the data values from top to bottom
Then, draw the frequency column and add the frequencies
Check to make sure the sum of the frequencies is $30$

Number of Books $(x)$ Tally Frequency $(f)$ $f * x$
$1$ II $2$ $2$
$2$ III $3$ $6$
$3$ IIII $5$ $15$
$4$ IIII I $6$ $24$
$5$ IIII II $7$ $35$
$6$ IIII $4$ $24$
$7$ III $3$ $21$
$\Sigma f = 30$ $\Sigma fx = 127$

$ (b)\:\: Highest\:\:Frequency = 7 \\[3ex] Number\:\:with\:\:the\:\:highest\:\:frequency = 5 \\[3ex] \therefore the\:\:modal\:\:number\:\:of\:\:books = 5 \:\:books\:\:bag \\[3ex] (c)\:\:(i)\:\: Total\:\:number\:\:of\:\:books = \Sigma fx = 127 \:\:books \\[3ex] (ii)\:\: \bar{x} = \dfrac{\Sigma fx}{\Sigma f} \\[5ex] \bar{x} = \dfrac{127}{30} \\[3ex] \bar{x} = 4.2333 \\[3ex] (d)\:\:Let\:\:E = event\:\:of\:\:less\:\:than\:\:4\:\:books \\[3ex] n(E) = 5 + 3 + 2 = 10 \\[3ex] n(S) = \Sigma f = 30 \\[3ex] P(E) = \dfrac{n(E)}{n(S)} \\[5ex] P(E) = \dfrac{10}{30} \\[5ex] P(E) = \dfrac{1}{3} $
(23.) ACT The 5 positive integers a, a, a, b and c have an average of a.
What is the value of $\dfrac{b + c}{2}$

$ F.\:\: \dfrac{a}{3} \\[5ex] G.\:\: \dfrac{a}{2} \\[5ex] H.\:\: a \\[3ex] J.\:\: 2a \\[3ex] K.\:\: 3a \\[3ex] $

$ \bar{x} = \dfrac{\Sigma x}{n} \\[5ex] \Sigma x = a + a + a + b + c = 3a + b + c \\[3ex] n = 5 \\[3ex] \bar{x} = a \\[3ex] \rightarrow a = \dfrac{3a + b + c}{5} \\[5ex] Cross\:\:Multiply \\[3ex] 5a = 3a + b + c \\[3ex] 5a - 3a = b + c \\[3ex] 2a = b + c \\[3ex] Divide\:\:both\:\:sides\:\:by\:\:2 \\[3ex] a = \dfrac{b + c}{2} \\[5ex] \dfrac{b + c}{2} = a $
(24.) ACT In a town of 500 people, the 300 males have an average age of 45 and the 200 females have an average age of 35
To the nearest year, what is the average age of the town's entire population?

$ A.\:\: 40 \\[3ex] B.\:\: 41 \\[3ex] C.\:\; 42 \\[3ex] D.\:\: 43 \\[3ex] E.\:\: 44 \\[3ex] $

$ \underline{Males} \\[3ex] n = 300 \\[3ex] \bar{x} = 45 \\[3ex] \Sigma x = \bar{x} * n \\[3ex] \Sigma x = 45 * 300 \\[3ex] \Sigma x = 13500 \\[3ex] \underline{Females} \\[3ex] n = 200 \\[3ex] \bar{x} = 35 \\[3ex] \Sigma x = \bar{x} * n \\[3ex] \Sigma x = 35 * 200 \\[3ex] \Sigma x = 7000 \\[3ex] \underline{Entire\:\:Town} \\[3ex] n = 500 \\[3ex] \Sigma x = \Sigma x (Males) + \Sigma x (Females) \\[3ex] \Sigma x = 13500 + 7000 \\[3ex] \Sigma x = 20500 \\[3ex] \bar{x} = \dfrac{\Sigma x}{n} \\[5ex] \bar{x} = \dfrac{20500}{500} \\[5ex] \bar{x} = 41 \\[3ex] $ The average age of the town's entire population is $41$ years.
(25.) The assessments in Mr. C's online Precalculus class are 15 discussion board assignments which includes 2 projects, 26 MML (My Math Lab) assignments, 3 tests, and a comprehensive final exam.
The final grade of his students are computed using the Weighted Average Method.
He rounds the final grades of his students to the nearest integer only one time.
The DB assignments are worth 15%
The MML assignments constitute 60%
The tests are 15%
The final exam is 10%
Hannah made a combined score of: 80% on the DB assignments and 90% on the MML assignments.
Her test scores were 96, 92, 84 percent respectively.
She made an 80% on the final exam.
Calculate her final grade.


$ 15\:\:DB\:\:Assignments\:\:of\:\:80\% \:\:weighted\:\: 15\% = 80(15) = 1200 \\[3ex] 26\:\:MML\:\:Assignments\:\:of\:\:90\% \:\:weighted\:\: 60\% = 90(60) = 5400 \\[3ex] Test\:\:1\:\:of\:\:96\% \:\:weighted\:\: 5\% = 96(5) = 480 \\[3ex] Test\:\:2\:\:of\:\:92\% \:\:weighted\:\: 5\% = 92(5) = 460 \\[3ex] Test\:\:3\:\:of\:\:84\% \:\:weighted\:\: 5\% = 84(5) = 420 \\[3ex] Final\:\:Exam\:\:of\:\:80\% \:\:weighted\:\: 10\% = 80(10) = 800 \\[3ex] Final\:\:Grade = \dfrac{1200 + 5400 + 480 + 460 + 420 + 800}{15 + 60 + 5 + 5 + 5 + 10} = \dfrac{8760}{100} \\[5ex] Final\:\:Grade = 87.6\% \approx 88\% $
(26.) curriculum.gov.mt The frequency table shows the distribution of the ages of a group of 52 people.

Ages in years Frequency
$20 - 30$ $3$
$31 - 40$ $25$
$41 - 50$ $17$
$51 - 60$ $6$
$61 - 70$ $1$

What is the modal group?


The modal group is the modal class.
It is the class that has the highest frequency.
Highest frequency = 25
The class that has it is $31 - 40$
Therefore, the modal group = $31 - 40$
(27.) The assessments in Mr. C's online Prealgebra class are 32 MOM (My Open Math) assignments, 3 tests, and a comprehensive final exam.
The final grade of his students are computed using the Weighted Average Method.
He rounds the final grades of his students to the nearest integer only one time.
The MOM assignments are worth 60%
Each test is 10%
The final exam is also 10%
Joel made a combined score of: 91.38% on the MOM assignments.
His test scores are 90, 65, 40 percent respectively.
He wants to make an A in the class. Can he make an A?
If he misses an A, he does not want to settle for anything less than a B. Can he make a B?
Calculate the score which he must make in the final exam to earn an A? a B?
If he cannot make an A or a B (but still has the opportunity to improve his grades), what would you advise him to do?


$ 32\:\:MOM\:\:Assignments\:\:of\:\:91.38\% \:\:weighted\:\: 60\% = 91.38(60) = 5482.8 \\[3ex] Test\:\:1\:\:of\:\:90\% \:\:weighted\:\: 10\% = 90(10) = 900 \\[3ex] Test\:\:2\:\:of\:\:65\% \:\:weighted\:\: 10\% = 65(10) = 650 \\[3ex] Test\:\:3\:\:of\:\:40\% \:\:weighted\:\: 10\% = 40(10) = 400 \\[3ex] Let\:\:the\:\:final\:\:exam\:\:score = p \\[3ex] Final\:\:Exam\:\:of\:\:p\% \:\:weighted\:\: 10\% = p(10) = 10p \\[3ex] Final\:\:Grade = \dfrac{5482.8 + 900 + 650 + 400 + 10p}{60 + 10 + 10 + 10 + 10} = \dfrac{7432.8 + 10p}{100} \\[5ex] Grade\:\:of\:\:A\:\:is \ge 90\% \\[3ex] \implies \dfrac{7432.8 + 10p}{100} \ge 90 \\[5ex] LCD = 100 \\[3ex] Multiply\:\:both\:\:sides\:\:by \:\: 100 \\[3ex] 100 * \dfrac{7432.8 + 10p}{100} \ge 100 * 90 \\[5ex] 7432.8 + 10p \ge 9000 \\[3ex] 10p \ge 9000 - 7432.8 \\[3ex] 10p \ge 1567.2 \\[3ex] p \ge \dfrac{1567.2}{10} \\[5ex] p \ge 156.72\% \\[3ex] Maximum = 100\% \\[3ex] Because\:\: 156.72\% \gt 100\%,\:\:he\:\:cannot\:\:make\:\:an\:\:A \\[3ex] Grade\:\:of\:\:B\:\:is\:\:between\:\: 80\%(inclusive)\:\:and\:\:89.49999999999999\%(inclusive) \\[3ex] \implies \dfrac{7432.8 + 10p}{100} \ge 80 \\[5ex] LCD = 100 \\[3ex] Multiply\:\:both\:\:sides\:\:by \:\: 100 \\[3ex] 100 * \dfrac{7432.8 + 10p}{100} \ge 100 * 80 \\[5ex] 7432.8 + 10p \ge 8000 \\[3ex] 10p \ge 8000 - 7432.8 \\[3ex] 10p \ge 567.2 \\[3ex] p \ge \dfrac{567.2}{10} \\[5ex] p \ge 56.72\% \\[3ex] Joel\:\:can\:\:still\:\:make\:\:a\:\:B \\[3ex] $ He needs to make at least $56.72\%$ ($56.72\%$ or better) on the final exam in order to make a $B$
(28.) ACT The mean of 5 integers is 52
The median of these 5 integers is 82
Three of the integers are 0, 12, and 82
Which of the following could be one of the other integers?

$ F.\:\: 52 \\[3ex] G.\:\: 66 \\[3ex] H.\:\: 84 \\[3ex] J.\:\: 86 \\[3ex] K.\:\: 105 \\[3ex] $

$ n = 5 \\[3ex] \bar{x} = 52 \\[3ex] \bar{x} = \dfrac{\Sigma x}{n} \\[5ex] \Sigma x = \bar{x} * n \\[3ex] \Sigma x = 52(5) \\[3ex] \Sigma x = 260 \\[3ex] \tilde{x} = 82...means\:\:the\:\:third\:\:number\:\:for\:\:sample\:\:of\:\:five \\[3ex] \implies 0, 12, 82, a, c \\[3ex] \rightarrow 0 + 12 + 82 + a + c = 260 \\[3ex] 94 + a + c = 260 \\[3ex] a + c = 260 - 94 \\[3ex] a + c = 166...Condition\:\:1 \\[3ex] fourth\:\:number\:\:\ge 82...Condition\:\:2 \\[3ex] Options\:\:F\:\:and\:\:G\:\:are\:\:eliminated \\[3ex] Assume\:\:fourth\:\:number = 82...the\:\:minimum \\[3ex] 82 + 84 = 166 = 166 ...possible \\[3ex] 82 + 86 = 168 \gt 166 ...not\:\:possible \\[3ex] 82 + 105 = 187 \gt 166 ...not\:\:possible \\[3ex] Correct\:\:Option = 84 = H $
(29.) WASSCE In a test, if a student had scored 80 marks in one of the subjects, his average mark in 8 subjects would be 62.
If he had scored 64 marks in that same subject with the scores in the remaining 7 subjects unchanged, the average mark would be m
Find the value of m.


$ \Sigma x_8 = sum\:\:of\:\:8\:\:subjects \\[3ex] \Sigma x_7 = sum\:\:of\:\:7\:\:subjects \\[3ex] \bar{x} = \dfrac{\Sigma x}{n} \\[5ex] \underline{First\:\:Scenario} \\[3ex] n = 8 \\[3ex] \Sigma x = \Sigma_8 = \Sigma x_7 + 80 \\[3ex] \bar{x} = 62 \\[3ex] \rightarrow 62 = \dfrac{\Sigma x_7 + 80}{8} \\[5ex] \Sigma x_7 + 80 = 62(8) \\[3ex] \Sigma x_7 + 80 = 496 \\[3ex] \Sigma x_7 = 496 - 80 = 416 \\[3ex] \underline{Second\:\:Scenario} \\[3ex] n = 8 \\[3ex] \Sigma x = \Sigma_8 = \Sigma x_7 + 64 = 416 + 64 = 480 \\[3ex] \bar{x} = m \\[3ex] \therefore m = \bar{x} = \dfrac{\Sigma x}{n} = \dfrac{480}{8} = 60 \\[5ex] m = 60 $
(30.) JAMB Find the mean of $t + 2$, $2t - 4$, $3t + 2$, and $2t$.

$ A.\:\: 2t \\[1em] B.\:\: 2t + 1 \\[1em] C.\:\: t \\[1em] D.\:\: t + 1 \\[1em] $

$ x = t + 2, 2t - 4, 3t + 2, 2t \\[1em] n = 4 \\[1em] \Sigma x = (t + 2) + (2t - 4) + (3t + 2) + 2t \\[1em] \Sigma x = t + 2 + 2t - 4 + 3t + 2 + 2t \\[1em] \Sigma x = 8t \\[1em] \bar{x} = \dfrac{\Sigma x}{n} \\[2em] \bar{x} = \dfrac{8t}{4} \\[2em] \bar{x} = 2t $
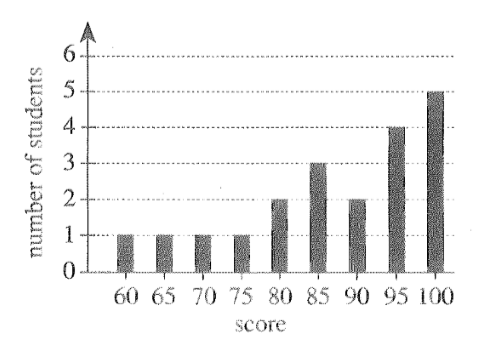
(31.) ACT Ms. Simons made a bar graph of the $20$ scores on the last math test, as shown below.
Which of the following statements about the mean of the $20$ scores is true?
Number 31

F. The mean is less than $75$
G. The mean is $75$
H. The mean is between $75$ and $85$
J. The mean is $85$
K. The mean is greater than $85$


$ Based\:\:on\:\:the\:\:bar\:\:graph \\[1em] 1\:\:student\:\:scored\:\:60 \\[1em] 1\:\:student\:\:scored\:\:65 \\[1em] 1\:\:student\:\:scored\:\:70 \\[1em] 1\:\:student\:\:scored\:\:75 \\[1em] 2\:\:students\:\:scored\:\:80 \\[1em] 3\:\:students\:\:scored\:\:85 \\[1em] 2\:\:students\:\:scored\:\:90 \\[1em] 4\:\:students\:\:scored\:\:95 \\[1em] 5\:\:students\:\:scored\:\:100 \\[1em] Number\:\:of\:\:students = 1 + 1 + 1 + 1 + 2 + 3 + 2 + 4 + 5 = 20\:\:students...to\:\:confirm\:\:20\:\:scores \\[1em] $
Scores, $x$ Frequencies, $f$ $f * x$
$60$ $1$ $60$
$65$ $1$ $65$
$70$ $1$ $70$
$75$ $1$ $75$
$80$ $2$ $160$
$85$ $3$ $255$
$90$ $2$ $180$
$95$ $4$ $380$
$100$ $5$ $500$
$\Sigma f = 20$ $\Sigma fx = 1745$

$ \bar{x} = \dfrac{\Sigma fx}{\Sigma f} \\[5ex] \bar{x} = \dfrac{1745}{20} \\[5ex] \bar{x} = 87.25 \\[1em] 87.25 \gt 85 $
(32.) ACT Set A and Set B each consist of $5$ distinct numbers.
The $2$ sets contain identical numbers with the exception of the number with the least value in each set.
The number with the least value in Set B is greater than the number with the least value in Set A.
The value of which of the following measures must be greater for Set B than for Set A?

A. Mean only
B. Median only
C. Mode only
D. Mean and median only
E. Mean, median, and mode


Let us write the two sets and ensure that the elements of the sets are listed in ascending order (from least to greatest).
We write these sets based on the information we were given.
Assume that:

$ A = \{1, 3, 4, 5, 6\} \\[1em] B = \{2, 3, 4, 5, 6\}...2 \gt 1 \\[1em] Median\:\:is\:\:the\:\:same = 4 \\[1em] Mode\:\:is\:\:the\:\:same...no\:\:mode \\[1em] Mean\:\:is\:\:different \\[1em] Mean\:\:of\:\:Set\:B \gt Mean\:\:of\:\:Set\: A \\[1em] How? \\[1em] \bar{x}\:\:of\:\:Set\:B = \dfrac{2 + 3 + 4 + 5 + 6}{5} = \dfrac{20}{5} = 4 \\[2em] \bar{x}\:\:of\:\:Set\:A = \dfrac{1 + 3 + 4 + 5 + 6}{5} = \dfrac{19}{5} \lt 4 $


Use the table below to answer the questions 33 and 34

JAMB
Score $4$ $7$ $8$ $11$ $13$ $8$
Frequency $3$ $5$ $2$ $7$ $2$ $1$


(33.) JAMB The mean score is

$ A.\:\: 7.0 \\[1em] B.\:\: 8.7 \\[1em] C.\:\: 9.5 \\[1em] D.\:\: 11.0 \\[1em] $

Score, $x$ Frequency, $f$ $f * x$
$4$ $3$ $12$
$7$ $5$ $35$
$8$ $2$ $16$
$11$ $7$ $77$
$13$ $2$ $26$
$8$ $1$ $8$
$\Sigma f = 20$ $\Sigma fx = 174$

$ \bar{x} = \dfrac{\Sigma fx}{\Sigma f} \\[5ex] \bar{x} = \dfrac{174}{20} = \dfrac{87}{10} \\[5ex] \bar{x} = 8.7 $
(34.) JAMB Find the square of the mode.

$ A.\:\: 49 \\[1em] B.\:\: 121 \\[1em] C.\:\: 25 \\[1em] D.\:\: 64 \\[1em] $

The mode is the score with the highest frequency.

Highest Frequency $= 7$

Score with $7 = 11$

Mode $= 11$

Square of the mode $= 11^2 = 121$
(35.) WASSCE If the mean of $m$, $n$, $s$, $p$, and $q$ is $12$, calculate the mean of $(m + 4)$, $(n - 3)$, $(s + 6)$, $(p - 2)$, and $(q + 8)$


$ For:\:\:m, n, s, p, q \\[1em] \bar{x} = \dfrac{m + n + s + p + q}{5} = 12 \\[2em] For:\:\:(m + 4), (n - 3), (s + 6), (p - 2), (q + 8) \\[1em] \bar{x} = \dfrac{(m + 4) + (n - 3) + (s + 6) + (p - 2) + (q + 8)}{5} \\[2em] = \dfrac{m + 4 + n - 3 + s + 6 + p - 2 + q + 8}{5} \\[2em] = \dfrac{m + n + s + p + q + 13}{5} \\[2em] = \dfrac{m + n + s + p + q}{5} + \dfrac{13}{5} \\[2em] = 12 + \dfrac{13}{5} \\[2em] = \dfrac{60}{5} + \dfrac{13}{5} \\[2em] = \dfrac{60 + 13}{5} \\[2em] = \dfrac{73}{5} \\[2em] = 14\dfrac{3}{5} $
(36.) WASSCE The arithmetic mean of $x$, $y$, and $z$ is $6$ while that of $x$, $y$, $z$, $t$, $u$, $v$, and $w$ is $9$.
Calculate the arithmetic mean of $t$, $u$, $v$, and $w$


$ \bar{x} = \dfrac{\Sigma x}{n} \\[2em] For\:\:x, y, z \\[1em] n = 3 \\[1em] \Sigma x = x + y + z \\[1em] \bar{x} = 6 \\[1em] \implies 6 = \dfrac{x + y + z}{3} \\[2em] x + y + z = 6(3) \\[1em] x + y + z = 18...eqn.(1) \\[1em] For\:\: x, y, z, t, u, v, w \\[1em] n = 7 \\[1em] \Sigma x = x + y + z + t + u + v + w \\[1em] \bar{x} = 9 \\[1em] \implies 9 = \dfrac{x + y + z + t + u + v + w}{7} \\[2em] x + y + z + t + u + v + w = 9(7) \\[1em] x + y + z + t + u + v + w = 63...eqn.(2) \\[1em] Substitute\:\:eqn.(1)\:\:into\:\:eqn.(2) \\[1em] 18 + t + u + v + w = 63 \\[1em] t + u + v + w = 63 - 18 \\[1em] t + u + v + w = 45 \\[1em] For\:\:t, u, v, w \\[1em] n = 4 \\[1em] \Sigma x = 45 \\[1em] \bar{x} = \dfrac{45}{4} \\[2em] \bar{x} = 11.25 $
(37.) JAMB
Marks $2$ $3$ $4$ $5$ $6$ $7$ $8$
No. of students $3$ $1$ $5$ $2$ $4$ $2$ $3$

From the table above, if the pass mark is $5$, how many students failed the test?

$ A.\:\: 6 \\[3ex] B.\:\: 2 \\[3ex] C.\:\: 9 \\[3ex] D.\:\: 7 \\[3ex] $

$ Pass\:\:mark = 5 \\[3ex] Number\:\:of\:\:students\:\:who\:\:made\:\:4 = 5 \\[3ex] Number\:\:of\:\:students\:\:who\:\:made\:\:3 = 1 \\[3ex] Number\:\:of\:\:students\:\:who\:\:made\:\:2 = 3 \\[3ex] Number\:\:of\:\:students\:\:who\:\:failed\:\:the\:\:test = 5 + 1 + 3 = 9 $
(38.) ACT The average weight of 10 boys is 77.0 pounds.
If the youngest boy is excluded, the average weight of the 9 remaining boys is 78.0 pounds.
What is the weight, in pounds, of the youngest boy?

$ A.\:\: 62 \\[3ex] B.\:\: 68 \\[3ex] C.\:\: 70 \\[3ex] D.\:\: 78 \\[3ex] E.\:\: 87 \\[3ex] $

$ \bar{x} = \dfrac{\Sigma x}{n} \\[2em] \Sigma x = n * \bar{x} \\[1em] n = 10 \\[1em] \bar{x}_{10} = 77 \\[1em] \Sigma x_{10} = 10 * 77 = 770 \\[1em] n = 9 \\[1em] \bar{x}_9 = 78 \\[1em] \Sigma x_9 = 9 * 78 = 702 \\[1em] Let\:\:the\:\:weight\:\:of\:\:the\:\:youngest\:\:boy = p \\[1em] \Sigma x_9 + p = \Sigma x_{10} \\[1em] 702 + p = 770 \\[1em] p = 770 - 702 \\[1em] p = 68 \\[1em] $ The youngest boy's weight is $68$ pounds.
(39.) JAMB
$x$ $2$ $4$ $6$ $8$
$f$ $4$ $y$ $6$ $5$

If the mean of the above frequency distribution is $5.2$, find $y$

$ A.\:\: 6.0 \\[1em] B.\:\: 5.2 \\[1em] C.\:\: 5.0 \\[1em] D.\:\: 4.0 \\[1em] $

$x$ $f$ $fx$
$2$ $4$ $8$
$4$ $y$ $4y$
$6$ $6$ $36$
$8$ $5$ $40$
$\Sigma f = 15 + y$ $\Sigma fx = 84 + 4y$


$ Mean = \bar{x} = \dfrac{\Sigma fx}{\Sigma f} \\[5ex] \implies \\[3ex] 5.2 = \dfrac{84 + 4y}{15 + y} \\[5ex] 5.2(15 + y) = 84 + 4y \\[3ex] 78 + 5.2y = 84 + 4y \\[3ex] 5.2y - 4y = 84 - 78 \\[3ex] 1.2y = 6 \\[3ex] y = \dfrac{6}{1.2} \\[5ex] y = 5 $
(40.) JAMB The mean of a set of six numbers is 60
If the mean of the first five is 50, find the sixth number in the set.

$ A.\:\: 95 \\[1em] B.\:\: 100 \\[1em] C.\:\: 110 \\[1em] D.\:\: 105 \\[1em] $

$ \Sigma x_6 = sum\:\:of\:\:six\:\:numbers \\[3ex] \Sigma x_5 = sum\:\:of\:\:first\:\:five\:\:numbers \\[3ex] For\:\:6\:\:numbers \\[3ex] \bar{x} = 60 \\[3ex] n = 6 \\[3ex] \bar{x} = \dfrac{\Sigma x}{n} \\[5ex] \rightarrow \Sigma x = \bar{x} * n \\[3ex] \Sigma x_6 = 60 * 6 = 360 \\[3ex] For\:\:5\:\:numbers \\[3ex] \bar{x} = 50 \\[3ex] n = 5 \\[3ex] \Sigma x_5 = 50 * 5 = 250 \\[3ex] Sixth\:\:number = \Sigma x_6 - \Sigma x_5 = 360 - 250 \\[3ex] \therefore Sixth\:\:number = 110 $


Top


(41.) JAMB The mean age of a group of students is 15 years.
When the age of a teacher, 45 years old, is added to the ages of the students, the mean of their ages becomes 18 years.
Find the number of students in the group.

$ A.\:\: 42 \\[1em] B.\:\: 15 \\[1em] C.\:\: 7 \\[1em] D.\:\: 9 \\[1em] $

$ \bar{x} = \dfrac{\Sigma x}{n} \\[2em] \Sigma x = \bar{x} * n \\[1em] Let\:\:the\:\:number\:\:of\:\:students = n \\[1em] For\:\:n \\[1em] \bar{x} = 15 \\[1em] \Sigma x = 15 * n = 15n \\[1em] Teacher\:\:is\:\:added \\[1em] Teacher\:\:is\:\:45\:\:years \\[1em] Sample\:\:size = n + 1 \\[1em] For\:\: n + 1 \\[1em] \bar{x} = 18 \\[1em] \Sigma x = 15n + 45 \\[1em] Also:\:\: \Sigma x = 18 * (n + 1) = 18(n + 1) \\[1em] \implies 15n + 45 = 18(n + 1) \\[1em] 15n + 45 = 18n + 18 \\[1em] 45 - 18 = 18n - 15n \\[1em] 27 = 3n \\[1em] 3n = 27 \\[1em] n = \dfrac{27}{3} \\[2em] n = 9 \\[1em] $ There are $9$ students in the group.

$ \underline{Check} \\[1em] Only\:\:the\:\:students \\[1em] n = 9 \\[1em] \bar{x} = 15 \\[1em] \Sigma x = 15(9) = 135 \\[1em] Students\:\:and\:\:Teacher \\[1em] n = 10 \\[1em] \Sigma x = 135 + 45 = 180 \\[1em] \bar{x} = \dfrac{180}{10} \\[2em] \bar{x} = 18 $
(42.) ACT The monthly fees for single rooms at 5 colleges are $370, $310, $380, $340 and $310 respectively.
What is the mean of these monthly fees?

$ A.\:\: \$310 \\[1em] B.\:\: \$340 \\[1em] C.\:\: \$342 \\[1em] D.\:\: \$350 \\[1em] E.\:\: \$380 \\[1em] $

$ x = 370, 310, 380, 340, 310 \\[1em] \Sigma x = 370 + 310 + 380 + 340 + 310 \\[1em] \Sigma x = 1710 \\[1em] n = 5 \\[1em] \bar{x} = \dfrac{\Sigma x}{n} \\[2em] \bar{x} = \dfrac{1710}{5} \\[2em] \bar{x} = \$342 $
(43.) JAMB The mean of seven numbers is $10$
If six of the numbers are 2, 4, 8, 14, 16 and 18, find the mode.

$ A.\:\: 8 \\[1em] B.\:\: 14 \\[1em] C.\:\: 2 \\[1em] D.\:\: 6 \\[1em] $

We need to find the seventh number.
Then, we can find the mode.

$ \bar{x} = \dfrac{\Sigma x}{n} \\[2em] Let\:\:the\:\:seventh\:\:number = p \\[1em] x = 2, 4, 8, 14, 16, 18, p \\[1em] n = 7 \\[1em] \Sigma x = 2 + 4 + 8 + 14 + 16 + 18 + p \\[1em] \Sigma x = 62 + p \\[1em] \bar{x} = 10 \\[1em] \implies 10 = \dfrac{62 + p}{7} \\[2em] 62 + p = 10(7) \\[1em] 62 + p = 70 \\[1em] p = 70 - 62 \\[1em] p = 8 \\[1em] \therefore x = 2, 4, 8, 14, 16, 18, 8 \\[1em] Highest\:\:frequency = 2...because\:\:8\:\:occured\:\:two\:\:times \\[1em] Number\:\:with\:the\:\:highest\:\:frequency = 8 \\[1em] Mode = 8 $
(44.) ACT To increase the mean of 4 numbers by 3, by how much would the sum of the 4 numbers have to increase?

$ F.\:\: \dfrac{3}{4} \\[5ex] G.\:\: 1 \\[3ex] H.\:\: \dfrac{4}{3} \\[5ex] J.\:\: 7 \\[3ex] K.\:\: 12 \\[3ex] $

We can solve this question using at least two approaches.
Choose any approach you prefer.
If you ask me which one you should use for the ACT, I would suggest the 2nd approach

$ \underline{1st\;\;Approach:\;\;Simplify\;\;using\;\;Algebra} \\[3ex] \bar{x} = \dfrac{\Sigma x}{n} \\[5ex] n = 4 \\[3ex] Increase\:\:\bar{x}\:\:by\:\: 3 \implies \bar{x} + 3 \\[3ex] \therefore \bar{x} + 3 = \dfrac{\Sigma x}{n} + 3 \\[5ex] \bar{x} + 3 = \dfrac{\Sigma x}{4} + 3 \\[5ex] \bar{x} + 3 = \dfrac{\Sigma x}{4} + \dfrac{12}{4} \\[5ex] \bar{x} + 3 = \dfrac{\Sigma x + 12}{4} \\[5ex] $ $\therefore \Sigma x$ should be increased by 12

$ \underline{2nd\;\;Approach:\;\;Test\;\;using\;\;Arithmetic} \\[3ex] \underline{Initial} \\[3ex] n = 4 \\[3ex] Assume:\;\;\bar{x} = 5 \\[3ex] \Sigma x = n * \bar{x} = 4(5) = 20 \\[3ex] \underline{New} \\[3ex] Increase\;\;\bar{x}\;\;by\;\;3 \implies \bar{x} = 5 + 3 = 8 \\[3ex] n = 4 \\[3ex] \Sigma x = n * \bar{x} = 4(8) = 32 \\[3ex] Change\;\;in\;\;\Sigma x = 32 - 20 = 12 \\[3ex] $ $\therefore \Sigma x$ should be increased by 12
(45.) ACT The table below shows the number of cars Jing sold each month last year.
What is the median of the data in the table?

Month Number of cars sold
January $25$
February $15$
March $22$
April $19$
May $16$
June $13$
July $19$
August $25$
September $26$
October $27$
November $28$
December $29$

$ F.\:\: 13 \\[1em] G.\:\: 16 \\[1em] H.\:\: 19 \\[1em] J.\:\: 20.5 \\[1em] K.\:\: 23.5 \\[1em] $

$ Arrange\:\:the\:\:data\:\:in\:\:ascending\:\:order \\[1em] 13, 15, 16, 19, 19, 22, 25, 25, 26, 27, 28, 29 \\[1em] Check\:\:to\:\:make\:\:sure\:\: n = 12 \\[1em] \tilde{x} = \dfrac{22 + 25}{2} \\[2em] \tilde{x} = \dfrac{47}{2} \\[2em] \tilde{x} = 23.5 $
(46.) JAMB
Age $20$ $25$ $30$ $35$ $40$ $45$
No. of people $3$ $5$ $1$ $1$ $2$ $3$

Calculate the median age of the frequency distribution in the table above.

$ A.\:\: 30 \\[1em] B.\:\: 35 \\[1em] C.\:\: 20 \\[1em] D.\:\: 25 \\[1em] $

We can solve this question in at least two ways.
Use any method you prefer.
However, because this is a JAMB question, the second method is recommended.

$ \underline{First\:\:Method:\:\: List\:\:the\:\:data\:\:values} \\[1em] 3\:\:people\:\:are\:\:20\:\:years \implies 20, 20, 20 \\[1em] 5\:\:people\:\:are\:\:25\:\:years \implies 25, 25, 25, 25, 25 \\[1em] 1\:\:person\:\:is\:\:30\:\:years \implies 30 \\[1em] 1\:\:person\:\:is\:\:35\:\:years \implies 35 \\[1em] 2\:\:people\:\:are\:\:40\:\:years \implies 40, 40 \\[1em] 3\:\:people\:\:are\:\:45\:\:years \implies 45, 45, 45 \\[1em] The\:\:dataset\:\:is \\[1em] 20, 20, 20, 25, 25, 25, 25, 25, 30, 35, 40, 40, 45, 45, 45 \\[1em] Median\:\:age\:\:is\:\:the\:\:middle\:\:number \\[1em] \tilde{x} = 25\:years \\[2em] \underline{Second\:\:Method} \\[1em] Age\:\:data\:\:is\:\:also\:\:sorted\:\:in\:\:ascending\:\:order \\[1em] \Sigma F = 3 + 5 + 1 + 1 + 2 + 3 = 15 \\[1em] \dfrac{\Sigma F}{2} = \dfrac{15}{2} = 7.5 \\[2em] Begin\:\:from\:\:the\:\:first\:\:age \\[1em] Keep\:\:adding\:\:the\:\:frequencies\:\:till\:\:you\:\:get\:\:7.5 \\[1em] 3 \\[1em] 3 + 5 = 8 \\[1em] 8 \:\:contains\:\: 7.5 \\[1em] STOP \\[1em] The\:\:age\:\:that\:\:has\:\:the\:\:median\:\:is\:\:25\:years \\[1em] \tilde{x} = 25\:years $
(47.) ACT The difference (larger minus smaller) between 2 numbers is 15
If n represents the larger number, which expression below represents the average (arithmetic mean) of the 2 numbers?

$ F.\:\: 7.5 \\[1em] G.\:\: n + 7.5 \\[1em] H.\:\: n + 15 \\[1em] J.\:\: n - 15 \\[1em] K.\:\: n - 7.5 \\[1em] $

$ n = larger\:\:number...from\:\:the\:\:question \\[1em] Let\:\:p = smaller\:\:number \\[1em] n - p = 15...eqn.(1) \\[1em] Because\:\:the\:\:options\:\:are\:\:expressed\:\:in\:\:n,\:\:we\:\:have\:\:to\:\:solve\:\:for\:\:p \\[1em] n - 15 = p \\[1em] p = n - 15...eqn.(2) \\[1em] For\:\:n, p \\[1em] sample\:\:size = 2 \\[1em] sum = n + p \\[1em] \bar{x} = \dfrac{sum}{sample\:\:size} \\[2em] \bar{x} = \dfrac{n + p}{2} \\[2em] Substitute\:\:(n - 15)\:\:for\:\:p \\[1em] \bar{x} = \dfrac{n + (n - 15)}{2} \\[2em] \bar{x} = \dfrac{n + n - 15}{2} \\[2em] \bar{x} = \dfrac{2n - 15}{2} \\[2em] \bar{x} = \dfrac{2n}{2} - \dfrac{15}{2} \\[2em] \bar{x} = n - 7.5 $
(48.) JAMB 5, 8, 6 and k occur with frequencies 3, 2, 4, and 1 respectively and have a mean of 5.7
Find the value of k

$ A.\:\: 4 \\[1em] B.\:\: 3 \\[1em] C.\:\: 2 \\[1em] D.\:\: 1 \\[1em] $

Numbers, $x$ Frequencies, $f$ $f * x$
$5$ $3$ $15$
$8$ $2$ $16$
$6$ $4$ $24$
$k$ $1$ $k$
$\Sigma f = 10$ $\Sigma fx = 55 + k$

$ \bar{x} = 5.7 \\[1em] \bar{x} = \dfrac{\Sigma fx}{\Sigma f} \\[2em] 5.7 = \dfrac{55 + k}{10} \\[2em] 55 + k = 5.7 (10) \\[1em] 55 + k = 57 \\[1em] k = 57 - 55 \\[1em] k = 2 $
(49.) NSC A large company employs several people.
The table below shows the number of people employed in each position and the monthly salary paid to each person in that position.

POSITION NUMBER EMPLOYED IN POSITION MONTHLY SALARY PER PERSON (IN RAND)
Managing director $1$ $150\:000$
Director $2$ $100\:000$
Manager $2$ $75\:000$
Foreman $5$ $15\:000$
Skilled workers $30$ $10\:000$
Semi-skilled workers $40$ $7\:500$
Unskilled workers $65$ $6\:000$
Administration $5$ $5\:000$

(49.1) Calculate the total number of people employed at this company.

(49.2) Calculate the total amount needed to pay salaries for ONE month.

(49.3) Determine the mean monthly salary for an employee in this company.

(49.4) Is the mean monthly salary calculated in QUESTION (49.3) a good indicator of an employee's monthly salary? Motivate your answer.


$ (49.1) \\[1em] \Sigma People = 1 + 2 + 2 + 5 + 30 + 40 + 65 + 5 = 150 \\[1em] n = 150 \\[1em] (49.2) \\[1em] \Sigma Amount\:\:for\:\:one\:\:month \\[1em] = 1(150000) + 2(100000) + 2(75000) + 5(15000) + 30(10000) + 40(7500) + 65(6000) + 5(5000) \\[1em] = 150000 + 200000 + 150000 + 75000 + 300000 + 300000 + 390000 + 25000 \\[1em] = R1590000 \\[1em] \Sigma x = R1590000 \\[1em] (49.3) \\[1em] \bar{x} = \dfrac{\Sigma x}{n} \\[2em] \bar{x} = \dfrac{1590000}{150} \\[2em] \bar{x} = R10600 \\[1em] (49.4) \\[1em] R10600 \gt R10000 \\[1em] 30\:\:people\:\:earn\:\:R10000\:\:each \\[1em] 40\:\:people\:\:earn\:\:R7500\:\:each \\[1em] 65\:\:people\:\:earn\:\:R6000\:\:each \\[1em] 5\:\:people\:\:earn\:\:R5000\:\:each \\[1em] So \\[1em] 30 + 40 + 65 + 5 = 140\:\:people\:\:earn\:\:less\:\:than\:\:R10600 \\[1em] 140\:\:people\:\:out\:\:of\:\:150\:\:people\:\:earn\:\:below\:\:the\:\:average/mean\:\:amount\:\:of\:\:R10600 \\[1em] \dfrac{140}{150} * 100 = 93.33\% \\[2em] More\:\:than\:\:90\%\:\:earn\:\:below\:\:average \\[1em] Is\:\:that\:\:fair? \\[1em] The\:\:mean\:\:amount\:\:of\:\:R10600\:\:is\:\:NOT\:\:a\:\:good\:\:indicator\:\:of\:\:an\:\:employee's\:\:monthly\:\:salary \\[1em] OR \\[1em] R10600 \lt R15000 \\[1em] 5\:\:people\:\:earn\:\:R15000\:\:each \\[1em] 2\:\:people\:\:earn\:\:R75000\:\:each \\[1em] 2\:\:people\:\:earn\:\:R100000\:\:each \\[1em] 1\:\:person\:\:earn\:\:R150000 \\[1em] So \\[1em] 1 + 2 + 2 + 5 = 10\:\:people\:\:make\:\:more\:\:than\:\:R10600 \\[1em] 10\:\:people\:\:out\:\:of\:\:150\:\:people\:\:earn\:\:above\:\:the\:\:average/mean\:\:amount\:\:of\:\:R10600 \\[1em] \dfrac{10}{150} * 100 = 6.67\% \\[2em] Less\:\:than\:\:7\%\:\:earn\:\:above\:\:average \\[1em] Is\:\:that\:\:fair? \\[1em] The\:\:mean\:\:amount\:\:of\:\:R10600\:\:is\:\:NOT\:\:a\:\:good\:\:indicator\:\:of\:\:an\:\:employee's\:\:monthly\:\:salary \\[1em] $ Discuss the issue of $1%$ in some countries
Discuss the issue of corruption and poverty in almost all African countries
Discuss the evil of looting by politicians.
(50.) WASSCE-FM The table gives the distribution of heights, in meters, of 100 students of the same age group.

Height $1.40 - 1.42$ $1.43 - 1.45$ $1.46 - 1.48$ $1.49 - 1.51$ $1.52 - 1.54$ $1.55 - 1.57$ $1.58 - 1.60$ $1.61 - 1.63$
Number of students $2$ $4$ $19$ $30$ $24$ $14$ $6$ $1$

(a) Calculate the mean height of the distribution.

(b) What is the probability that the height of a student selected at random is greater than the mean height of the distribution?


Check to make sure the grouped data has equal class intervals.
In other words, the class size must be the same for all the classes.

Height, $x$ Frequency, $f$ $x_{mid} = \dfrac{LCI + UCI}{2}$ $f * x_{mid}$
$1.40 - 1.42$ $2$ $\dfrac{1.4 + 1.42}{2} = \dfrac{2.82}{2} = 1.41$ $2.82$
$1.43 - 1.45$ $4$ $\dfrac{1.43 + 1.45}{2} = \dfrac{2.88}{2} = 1.44$ $5.76$
$1.46 - 1.48$ $19$ $\dfrac{1.46 + 1.48}{2} = \dfrac{2.94}{2} = 1.47$ $27.93$
$1.49 - 1.51$ $30$ $\dfrac{1.49 + 1.51}{2} = \dfrac{3}{2} = 1.5$ $45$
$1.52 - 1.54$ $24$ $\dfrac{1.52 + 1.54}{2} = \dfrac{3.06}{2} = 1.53$ $36.72$
$1.55 - 1.57$ $14$ $\dfrac{1.55 + 1.57}{2} = \dfrac{3.12}{2} = 1.56$ $21.84$
$1.58 - 1.6$ $6$ $\dfrac{1.58 + 1.6}{2} = \dfrac{3.18}{2} = 1.59$ $9.54$
$1.61 - 1.63$ $1$ $\dfrac{1.61 + 1.63}{2} = \dfrac{3.24}{2} = 1.62$ $1.62$
$\Sigma f = 100$ $\Sigma fx_{mid} = 151.23$

$ (a.) \\[1em] \bar{x} = \dfrac{\Sigma fx_{mid}}{\Sigma f} \\[2em] \bar{x} = \dfrac{151.23}{100} \\[2em] \bar{x} = 1.5123 \\[1em] Mean\:\:height = 1.5123\:meters \\[2em] (b) \\[1em] n(S) = \Sigma f = 100 \\[1em] Let\:\:the\:\:event\:\:of\:\:selecting\:\:a\:\:student\:\:whose\:\:height\:\:is\:\:greater\:\:than\:\:the\:\:mean\:\:height \\[1em] n(E) = 24 + 14 + 6 + 1 = 45 \\[1em] P(E) = \dfrac{n(E)}{n(S)} \\[2em] P(E) = \dfrac{45}{100} \\[2em] P(E) = \dfrac{9}{20} $
(51.) WASSCE-FM The table below shows the marks obtained by a group of students.

Marks $0 - 9$ $10 - 19$ $20 - 29$ $30 - 39$ $40 - 49$ $50 - 59$ $60 - 69$ $70 - 79$
Number of students $2$ $5$ $9$ $15$ $18$ $14$ $10$ $7$

(a) If a student is selected at random from the group, find the probability that this student scored at most $69$ marks.

(b) Calculate the median of the distribution.


The number of students is the frequency, $f$

$ (a.) \\[1em] \Sigma f = 2 + 5 + 9 + 15 + 18 + 14 + 10 + 7 \\[1em] \Sigma f = 80 \\[1em] n(S) = 80 \\[1em] At\:\:most\:\:69\:\:means\:\:\le 69 \\[1em] Let\:\:E = probability\:\:of\:\:selecting\:\:a\:\:student\:\:who\:\:scored\:\: \le 69 \\[1em] Number\:\:of\:\:students\:\:who\:\:scored\:\:less\:\:than\:\:or\:\:equal\:\:to\:\:69 \\[1em] = 2 + 5 + 9 + 15 + 18 + 14 + 10 \\[1em] = 73 \\[1em] n(E) = 73 \\[1em] P(E) = \dfrac{n(E)}{n(S)} \\[2em] P(E) = \dfrac{73}{80} \\[2em] $
Marks, $x$ Frequency, $F$ Class Boundaries Cumulative Frequency, $CF$
$0 - 9$ $2$ $0 - 9.5$ $2$
$10 - 19$ $5$ $9.5 - 19.5$ $2 + 5 = 7$
$20 - 29$ $9$ $19.5 - 29.5$ $7 + 9 = 16$
$30 - 39$ $15$ $29.5 - 39.5$ $16 + 15 = \color{darkblue}{31}$
$\color{darkblue}{40 - 49}$ $\color{darkblue}{18}$ $\color{darkblue}{39.5} - 49.5$ $31 + 18 = 49$
$50 - 59$ $14$ $49.5 - 59.5$ $49 + 14 = 63$
$60 - 69$ $10$ $59.5 - 69.5$ $63 + 10 = 73$
$70 - 79$ $7$ $69.5 - 79.5$ $73 + 7 = 80$
$\Sigma F = 80$

$ (b.) \\[1em] First:\:\:Determine\:\:the\:\:median\:\:class \\[1em] \dfrac{\Sigma F}{2} = \dfrac{80}{2} = 40 \\[2em] Begin\:\:from\:\:the\:\:first\:\:class \\[1em] Keep\:\:adding\:\:the\:\:frequencies\:\:till\:\:you\:\:get\:\:40 \\[1em] 2 + 5 = 7 \\[1em] 7 + 9 = 16 \\[1em] 16 + 15 = 31 \\[1em] 31 + 18 = 49 \\[1em] 49 \:\:contains\:\: 40 \\[1em] STOP \\[1em] The\:\:median\:\:class = 40 - 49 \\[1em] \tilde{x} = LCB_{med} + \dfrac{CW}{f_{med}} * \left[\left(\dfrac{\Sigma F}{2}\right) - CF_{bmed}\right] \\[2em] med = 40 - 49 \\[1em] LCB_{med} = 39.5 \\[1em] CW = 49.5 - 39.5 = 10 \\[1em] f_{med} = 18 \\[1em] CF_{bmed} = 31 \\[1em] \implies \tilde{x} = 39.5 + \dfrac{10}{18} * \left[\left(\dfrac{80}{2}\right) - 31\right] \\[2em] \tilde{x} = 39.5 + \dfrac{10}{18} * (40 - 31) \\[2em] \tilde{x} = 39.5 + \dfrac{10}{18} * 9 \\[2em] \tilde{x} = 39.5 \dfrac{10}{2} \\[2em] \tilde{x} = 39.5 + 5 \\[1em] \tilde{x} = 44.5\:marks $
(52.) WASSCE-FM The table shows the distribution of the lengths of 20 iron rods measured in metres.

Length (m) $1.0 - 1.1$ $1.2 - 1.3$ $1.4 - 1.5$ $1.6 - 1.7$ $1.8 - 1.9$
Frequency $2$ $3$ $8$ $5$ $2$

Using an assumed mean (AM) of $1.45$, calculate the mean of the distribution.


Check to make sure the grouped data has equal class intervals.
In other words, the class size must be the same for all the classes.
$AM = 1.45$

Length (m), $x$ Frequency, $f$ $x_{mid} = \dfrac{LCI + UCI}{2}$ $D = x_{mid} - AM$ $f * D$
$1.0 - 1.1$ $2$ $\dfrac{1.0 + 1.1}{2} = \dfrac{2.1}{2} = 1.05$ $1.05 - 1.45 = -0.4$ $2(-0.4) = -0.8$
$1.2 - 1.3$ $3$ $\dfrac{1.2 + 1.3}{2} = \dfrac{2.5}{2} = 1.25$ $1.25 - 1.45 = -0.2$ $3(-0.2) = -0.6$
$1.4 - 1.5$ $8$ $\dfrac{1.4 + 1.5}{2} = \dfrac{2.9}{2} = 1.45$ $1.45 - 1.45 = 0$ $8(0) = 0$
$1.6 - 1.7$ $5$ $\dfrac{1.6 + 1.7}{2} = \dfrac{3.3}{2} = 1.65$ $1.65 - 1.45 = 0.2$ $5(0.2) = 1.0$
$1.8 - 1.9$ $2$ $\dfrac{1.8 + 1.9}{2} = \dfrac{3.7}{2} = 1.85$ $1.85 - 1.45 = 0.4$ $2(0.4) = 0.8$
$\Sigma f = 20$ $\Sigma fD = 0.4$

$ \bar{x} = AM + \dfrac{\Sigma fD}{\Sigma f} \\[2em] \bar{x} = 1.45 + \dfrac{0.4}{20} \\[2em] \bar{x} = 1.45 + 0.02 \\[1em] Mean\:\:height = 1.47\:metres $
(53.) JAMB
No. of children $0$ $1$ $2$ $3$ $4$ $5$ $6$
No. of families $7$ $11$ $6$ $7$ $7$ $5$ $3$

Find the mode and median respectively of the distribution above

$ A.\:\: 2, 1 \\[1em] B.\:\: 1, 2 \\[1em] C.\:\: 1, 5 \\[1em] D.\:\: 5, 2 \\[1em] $

Similar to Question $46$
Let us use only the second method to solve this question

$ \underline{Second\:\:Method} \\[1em] \underline{Median} \\[3ex] No.\:\:of\;\;children\:\:has\:\:been\:\:sorted\:\:in\:\:ascending\:\:order \\[1em] \Sigma F = 7 + 11 + 6 + 7 + 7 + 5 + 3 = 46 \\[1em] \dfrac{\Sigma F}{2} = \dfrac{46}{2} = 23 \\[2em] Begin\:\:from\:\:the\:\:first\:\:No.\;\;of\;\;children \\[1em] Keep\:\:adding\:\:the\:\:frequencies\:\:till\:\:you\:\:get\:\:23 \\[1em] 7 \\[1em] 7 + 11 = 18 \\[1em] 18 + 6 = 24 \\[1em] 24 \:\:contains\:\: 23 \\[1em] STOP \\[1em] The\:\:No.\;\;of\;\;children\:\:that\:\:has\:\:the\:\:median\:\:is\:\:2 \\[1em] \tilde{x} = 2 \\[3ex] \underline{Mode} \\[3ex] Mode = No.\;\;of\;\;children\;\;with\;\;the\;\;highest\;\;No.\;\;of\;\;families(highest\;\;frequency) \\[3ex] Highest\;\;frequency = 11 \\[3ex] No.\;\;of\;\;children\;\;having\;\;11\;\;families = 1 \\[3ex] \hat{x} = 1 \\[3ex] (Median, Mode) = (\tilde{x}, \hat{x}) = (2, 1) $
(54.) JAMB The mean of seven numbers is 96.
If an eighth number is added, the mean becomes 112.
Find the eighth number.

$ A.\:\: 126 \\[3ex] B.\:\: 180 \\[3ex] C.\:\: 216 \\[3ex] D.\:\: 224 \\[3ex] $

$ \Sigma x_7 = sum\:\:of\:\:7\:\:subjects \\[3ex] \Sigma x_8 = sum\:\:of\:\:8\:\:subjects \\[3ex] For\:\:7\:\:numbers \\[3ex] \bar{x} = 96 \\[3ex] n = 7 \\[3ex] \bar{x} = \dfrac{\Sigma x}{n} \\[5ex] \rightarrow \Sigma x = \bar{x} * n \\[3ex] \Sigma x_7 = 96 * 7 = 672 \\[3ex] For\:\:8\:\:numbers \\[3ex] \bar{x} = 112 \\[3ex] n = 8 \\[3ex] \Sigma x_8 = 112 * 8 = 896 \\[3ex] Eighth\:\:number = \Sigma x_8 - \Sigma x_7 = 896 - 672 \\[3ex] \therefore Eighth\:\:number = 224 $
(55.) ACT On the first 7 statistics tests of the semester, Jamal scored 61, 76, 79, 80, 80, 84, and 91.
The mean, median, and mode of his scores were 79, 80, and 80 respectively.
On the 8th statistics test, Jamal scored 90.
How do the mean, median, and mode of all 8 of his scores compare to the mean, median, and mode of his first 7 scores?

     Mean    Median    Mode
A.    equal     greater     greater
B.   greater     greater     greater
C.   greater     greater     equal
D.   greater     equal      greater
E.   greater     equal      equal


Old Dataset
Old dataset = 61, 76, 79, 80, 80, 84, and 91
Mean = 79
Sample size = 7
This implies that: sum of the scores = Mean × Sample size = 79(7) = 553 (you can verify if you have time)

New Dataset
New dataset (which includes the 8th statistics test) = x = 61, 76, 79, 80, 80, 84, 90, and 91
Sum of scores = sum of scores of old dataset + new score = 553 + 90 = 643
Sample size = 8

$ Mean = \dfrac{\Sigma x}{n} \\[5ex] = \dfrac{643}{8} \\[5ex] = 80.375 \\[3ex] Compare\;\;to\;\;Mean\;\;of\;\;Old\;\;Dataset:\;\; 80.375 \gt 79 \\[3ex] Median = \dfrac{80 + 80}{2} \\[5ex] = \dfrac{160}{2} \\[5ex] = 80 \\[3ex] Compare\;\;to\;\;Median\;\;of\;\;Old\;\;Dataset:\;\; 80 = 80 \\[3ex] Mode = 80 \\[3ex] Compare\;\;to\;\;Mode\;\;of\;\;Old\;\;Dataset:\;\; 80 = 80 \\[3ex] $ So, we have it in the order of mean, median, mode as:
  greater     equal     equal
(56.) WASSCE The mean of 22, 18, (2$x$ + 1), 10 and 20 is 15.
Find the median.


$ Mean = \dfrac{22 + 18 + (2x + 1) + 10 + 20}{5} \\[5ex] Mean = 15 \\[3ex] \implies \\[3ex] \dfrac{22 + 18 + (2x + 1) + 10 + 20}{5} = 15 \\[5ex] \dfrac{40 + 2x + 1 + 30}{5} = 15 \\[5ex] 40 + 2x + 1 + 30 = 15(5) \\[3ex] 2x + 71 = 75 \\[3ex] 2x = 75 - 71 \\[3ex] 2x = 4 \\[3ex] x = \dfrac{4}{2} \\[5ex] x = 2 \\[3ex] 2x + 1 = 2(2) + 1 = 4 + 1 = 5 \\[3ex] Dataset = 22,\;\;18,\;\;5,\;\;10,\;\;20 \\[3ex] Dataset(sorted) = 5,\;\;10,\;\;18,\;\;20,\;\;22 \\[3ex] Median = 18 $
(57.) ACT The table below gives some statistics based on the points Veronica earned on each of her first 3 math exams.

Statistic Points
Median
Range
Maximum
80
11
90

If it can be determined, what is the mean number of points Veronica earned on her first 3 math exams?

$ F.\;\; 79 \\[3ex] G.\;\; 80 \\[3ex] H.\;\; 83 \\[3ex] J.\;\; 85 \\[3ex] K.\;\;Cannot\;\;be\;\;determined\;\;from\;\;the\;\;given\;\;information \\[3ex] $

$ \underline{First\;\;3\;\;math\;\;exams} \\[3ex] n = 3 \\[3ex] range = 11 \\[3ex] maximum = 90 \\[3ex] range = maximum - minimum \\[3ex] minimum = maximum - range \\[3ex] minimum = 90 - 11 \\[3ex] minimum = 79 \\[3ex] median = 80 \\[3ex] \implies \\[3ex] points = x = 79, 80, 90 \\[3ex] \Sigma x = 79 + 80 + 90 = 249 \\[3ex] mean = \dfrac{\Sigma x}{n} \\[5ex] mean = \dfrac{249}{3} \\[5ex] mean = 83 $
(58.) ACT Data from a random sample of 335 car owners in a certain city are listed below.
The table indicates the number of owners in 3 age brackets (16 – 25, 26 – 45, 46 – 60) who own cars from 3 car companies (A, B, C) in this city.
Each owner in the sample owns only 1 car.

Car companies
Age (in years) A B C Total
16 – 25
26 – 45
46 – 60
16
54
65
24
48
23
40
53
12
80
155
100
Total 135 95 105 335

For those in the sample who are 26 to 45 years old, which of the following values is closest to the average number of car owners per company?

$ A.\;\; 37 \\[3ex] B.\;\; 45 \\[3ex] C.\;\; 52 \\[3ex] D.\;\; 112 \\[3ex] E.\;\; 155 \\[3ex] $

$ \underline{For\;\;26 - 45\;\;years} \\[3ex] Number\;\;of\;\;car\;\;owners = 155 \\[3ex] Number\;\;of\;\;companies = 3 \\[3ex] Average\;\;number\;\;of\;\;car\;\;owners\;\;per\;\;company \\[3ex] = \dfrac{155}{3} \\[5ex] = 51.66666667 \\[3ex] \approx 52\% $
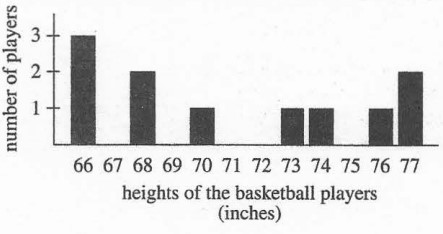
(59.) ACT The frequency histogram below shows the distribution of the heights, in inches, of 11 basketball players.

Number 59

Using the data from the frequency histogram, what is the sum of the mean and the median of this distribution?

$ F.\;\; 141 \\[3ex] G.\;\; 142 \\[3ex] H.\;\; 143 \\[3ex] J.\;\; 144 \\[3ex] K.\;\; 145 \\[3ex] $

Let us convert the histogram to a frequency table.

Heights of the basketball players, x Number of players, f f * x
66 3 66 * 3 = 198
68 2 68 * 2 = 136
70 1 70 * 1 = 70
73 1 73 * 1 = 73
74 1 74 * 1 = 74
76 1 76 * 1 = 76
77 2 77 * 2 = 154
Σf = 11 Σfx = 781

$ mean = \dfrac{\Sigma fx}{\Sigma f} \\[5ex] = \dfrac{781}{11} \\[5ex] = 71 \\[3ex] \dfrac{11}{2} = 5.5 \\[5ex] \downarrow From\;\;the\;\;top:\;\; 3 + 2 = 5 \\[3ex] Needs\;\;0.5\;\;from\;\; 1 ...STOP \\[3ex] \uparrow From\;\;the\;\;bottom:\;\; 2 + 1 + 1 + 1 = 5 \\[3ex] Needs\;\;0.5\;\;from\;\; 1 ...STOP \\[3ex] That\;\;1 \implies 70\;\;is\;\;the\;\;middle \\[3ex] median = 70 \\[3ex] mean + median \\[3ex] = 71 + 70 \\[3ex] = 141 $
(60.) ACT To increase the mean of 7 numbers by 4, by how much would the sum of the 7 numbers have to increase?

$ A.\:\: 4 \\[3ex] B.\:\: 7 \\[3ex] C.\:\: 11 \\[3ex] D.\:\: 28 \\[3ex] E.\:\: 56 \\[3ex] $

We can solve this question using at least two approaches.
Choose any approach you prefer.
If you ask me which one you should use for the ACT, I would suggest the 2nd approach

$ \underline{1st\;\;Approach:\;\;Simplify\;\;using\;\;Algebra} \\[3ex] \bar{x} = \dfrac{\Sigma x}{n} \\[5ex] n = 7 \\[3ex] Increase\:\:\bar{x}\:\:by\:\: 4 \implies \bar{x} + 4 \\[3ex] \therefore \bar{x} + 4 = \dfrac{\Sigma x}{n} + 4 \\[5ex] \bar{x} + 4 = \dfrac{\Sigma x}{7} + 4 \\[5ex] \bar{x} + 4 = \dfrac{\Sigma x}{7} + \dfrac{28}{7} \\[5ex] \bar{x} + 4 = \dfrac{\Sigma x + 28}{7} \\[5ex] $ $\therefore \Sigma x$ should be increased by 28

$ \underline{2nd\;\;Approach:\;\;Test\;\;using\;\;Arithmetic} \\[3ex] \underline{Initial} \\[3ex] n = 7 \\[3ex] Assume:\;\;\bar{x} = 5 \\[3ex] \Sigma x = n * \bar{x} = 7(5) = 35 \\[3ex] \underline{New} \\[3ex] Increase\;\;\bar{x}\;\;by\;\;4 \implies \bar{x} = 5 + 4 = 9 \\[3ex] n = 7 \\[3ex] \Sigma x = n * \bar{x} = 7(9) = 63 \\[3ex] Change\;\;in\;\;\Sigma x = 63 - 35 = 28 \\[3ex] $ $\therefore \Sigma x$ should be increased by 28


Top


(61.) ACT The average of a list of 4 numbers is 92.0.
A new list of 4 numbers has the same first 3 numbers as the original list, but the fourth number in the original list is 40, and the fourth number in the new list is 48.
What is the average of this new list of numbers?

$ F.\;\; 81.0 \\[3ex] G.\;\; 92.0 \\[3ex] H.\;\; 94.0 \\[3ex] J.\;\; 94.4 \\[3ex] K.\;\; 96.6 \\[3ex] $

There are two lists of 4 numbers: original list and new list
The original list and the new list have 4 numbers. This means that the sample size for both lists = 4
The original list and the new list have the same first 3 numbers but different fourth numbers
This implies that the sum of the first 3 numbers in both lists is the same
Let us call the sum of the first 3 numbers as Σthree

$ \underline{Original\;\;List} \\[3ex] Mean = 92.0 = 92 \\[3ex] n = 4 \\[3ex] \Sigma x = \Sigma three + fourth\;\;number \\[3ex] \Sigma x = \Sigma three + 40 \\[3ex] Mean = \dfrac{\Sigma x}{n} \\[5ex] \implies \\[3ex] 92 = \dfrac{\Sigma three + 40}{4} \\[5ex] \Sigma three + 40 = 92(4) \\[3ex] \Sigma three + 40 = 368 \\[3ex] \Sigma three = 368 - 40 \\[3ex] \Sigma three = 328 \\[3ex] \underline{New\;\;List} \\[3ex] Mean = ?
n = 4 \\[3ex] \Sigma three = 328 \\[3ex] \Sigma x = \Sigma three + fourth\;\;number \\[3ex] \Sigma x = 328 + 48 \\[3ex] \Sigma x = 376 \\[3ex] Mean = \dfrac{\Sigma x}{n} \\[5ex] Mean = \dfrac{376}{4} \\[5ex] Mean = 94 = 94.0 $
(62.) ACT The mean age of the 5 people in a room is 30 years.
One of the 5 people, whose age is 50 years, leaves the room.
What is the mean age of the 4 people remaining in the room?

$ A.\;\; 14 \\[3ex] B.\;\; 20 \\[3ex] C.\;\; 25 \\[3ex] D.\;\; 30 \\[3ex] E.\;\; 35 \\[3ex] $

$ \underline{Original\;\;List} \\[3ex] Mean = 30 \\[3ex] n = 5 \\[3ex] \Sigma x = n * Mean = 5 * 30 = 150 \\[3ex] \underline{Changed\;\;List} \\[3ex] x = 50 \;\;leaves\;\;the\;\;room \\[3ex] \Sigma x = 150 - 50 = 100 \\[3ex] n = 4 \\[3ex] Mean = \dfrac{\Sigma x}{n} \\[5ex] = \dfrac{100}{4} \\[5ex] = 25 $
(63.)

(64.) ACT Widely considered one of the greatest film directors, Alfred Hitchcock directed over 60 films.
The table below gives some information about Hitchcock's last 12 films.
Title Year of release Length (minutes)
The Trouble with Harry
The Man Who Knew Too Much
The Wrong Man
Vertigo
North by Northwest
Psycho
The Birds
Marnie
Torn Curtain
Topaz
Frenzy
Family Plot
1955
1956
1956
1958
1959
1960
1963
1964
1966
1969
1972
1976
99
120
105
128
136
109
119
130
128
143
?
?

What is the median of the given lengths, in minutes, of the 10 Hitchcock films released before 1972?

$ F.\;\; 120.0 \\[3ex] G.\;\; 121.7 \\[3ex] H.\;\; 122.5 \\[3ex] J.\;\; 124.0 \\[3ex] K.\;\; 128.0 \\[3ex] $

The lengths arranged in ascending order is:
99, 105, 109, 119, 120, 128, 128, 130, 136, 143

$ Median = \dfrac{120 + 128}{2} \\[5ex] = \dfrac{248}{2} \\[5ex] = 124 \\[3ex] = 124.0\;minutes $
(65.) WASSCE-FM The table shows the distribution of wages earned by employees in a company.

Wages ($\$$) $40 - 49$ $50 - 59$ $60 - 69$ $70 - 79$ $80 - 89$ $90 - 99$ $100 - 109$ $110 - 119$
Number of Employees $4$ $12$ $14$ $11$ $7$ $5$ $2$ $1$

Using an assumed mean (AM) of $\$74.50$, find the mean wage.


Check to make sure the grouped data has equal class intervals.
In other words, the class size must be the same for all the classes.
$AM = 74.50$

Wages ($\$$), $x$ Number of Employees, $f$ $x_{mid} = \dfrac{LCI + UCI}{2}$ $D = x_{mid} - AM$ $f * D$
$40 - 49$ $4$ $\dfrac{40 + 49}{2} = \dfrac{89}{2} = 44.5$ $44.5 - 74.5 = -30$ $4(-30) = -120$
$50 - 59$ $12$ $\dfrac{50 + 59}{2} = \dfrac{109}{2} = 54.5$ $54.5 - 74.5 = -20$ $12(-20) = -240$
$60 - 69$ $14$ $\dfrac{60 + 69}{2} = \dfrac{129}{2} = 64.5$ $64.5 - 74.5 = -10$ $14(-10) = -140$
$70 - 79$ $11$ $\dfrac{70 + 79}{2} = \dfrac{149}{2} = 74.5$ $74.5 - 74.5 = 0$ $11(0) = 0$
$80 - 89$ $7$ $\dfrac{80 + 89}{2} = \dfrac{169}{2} = 84.5$ $84.5 - 74.5 = 10$ $7(10) = 70$
$90 - 99$ $5$ $\dfrac{90 + 99}{2} = \dfrac{189}{2} = 94.5$ $94.5 - 74.5 = 20$ $5(20) = 100$
$100 - 109$ $2$ $\dfrac{100 + 109}{2} = \dfrac{209}{2} = 104.5$ $104.5 - 74.5 = 30$ $2(30) = 60$
$110 - 119$ $1$ $\dfrac{110 + 119}{2} = \dfrac{229}{2} = 114.5$ $114.5 - 74.5 = 40$ $1(40) = 40$
$\Sigma f = 56$ $\Sigma fD = -230$

$ \bar{x} = AM + \dfrac{\Sigma fD}{\Sigma f} \\[5ex] \bar{x} = 74.5 + \dfrac{-230}{56} \\[5ex] \bar{x} = 74.5 - 4.107142857 \\[3ex] \bar{x} = 70.39285714 \\[3ex] Mean\:\:wage = \$70.39 $
(66.)

Check to make sure the grouped data has equal class intervals.
In other words, the class size must be the same for all the classes.
$AM = 13$

Age (in years), $x$ Number of people, $f$ $x_{mid} = \dfrac{LCI + UCI}{2}$ $D = x_{mid} - AM$ $f * D$
$1 - 5$ $18$ $\dfrac{1 + 5}{2} = \dfrac{6}{2} = 3$ $3 - 13 = -10$ $18(-10) = -180$
$6 - 10$ $12$ $\dfrac{6 + 10}{2} = \dfrac{16}{2} = 8$ $8 - 13 = -5$ $12(-5) = -60$
$11 - 15$ $25$ $\dfrac{11 + 15}{2} = \dfrac{26}{2} = 13$ $13 - 13 = 0$ $25(0) = 0$
$16 - 20$ $15$ $\dfrac{16 + 20}{2} = \dfrac{36}{2} = 18$ $18 - 13 = 5$ $15(5) = 75$
$21 - 25$ $20$ $\dfrac{21 + 25}{2} = \dfrac{46}{2} = 23$ $23 - 13 = 10$ $20(10) = 200$
$26 - 30$ $10$ $\dfrac{26 + 30}{2} = \dfrac{56}{2} = 28$ $28 - 13 = 15$ $10(15) = 150$
$\Sigma f = 100$ $\Sigma fD = 185$

$ \bar{x} = AM + \dfrac{\Sigma fD}{\Sigma f} \\[5ex] \bar{x} = 13 + \dfrac{185}{100} \\[5ex] \bar{x} = 13 + 1.85 \\[3ex] \bar{x} = 14.85 \\[3ex] Mean\:\:age = 14.85\;years $
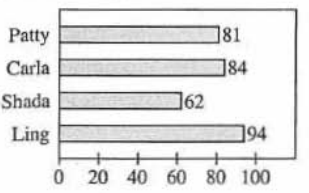
(67.) ACT Patty, Carla, Shada, and Ling ran a race.
The bar graph below gives each girl's running time, in seconds.
How many of the girls ran the race in less time than the average of the 4 running times?

Number 67

$ F.\;\; 0 \\[3ex] G.\;\; 1 \\[3ex] H.\;\; 2 \\[3ex] J.\;\; 3 \\[3ex] K.\;\; 4 \\[3ex] $

Running time of:
Patty = 81 seconds
Carla = 84 seconds
Shada = 62 seconds
Ling = 94 seconds

$ Average\;\;of\;\;the\;\;four\;\;running\;\;times \\[3ex] = \dfrac{81 + 84 + 62 + 94}{4} \\[5ex] = \dfrac{321}{4} \\[5ex] = 80.25 \\[3ex] 62 \lt 80.25 \\[3ex] $ Shada's running time is less than the average running time
1 girl ran the race in less time than the average of the 4 running times.
(68.) ACT A community theater group performed at 5 local schools.
For each school, the table below shows the total number of tickets sold and the total dollar amount collected from ticket sales.

School Number of tickets sold Tickets sales
A
B
C
D
E
200
250
300
150
275
$1,400
$1,650
$1,800
$1,350
$1,625

What is the difference between the median and the mean number of tickets sold at the 5 schools?

$ F.\;\; 75 \\[3ex] G.\;\; 65 \\[3ex] H.\;\; 50 \\[3ex] J.\;\; 40 \\[3ex] K.\;\; 15 \\[3ex] $

Ticket sales is not the frequency.
Number of tickets sold at the 5 schools, x are: 200, 250, 300, 150, 275
Number of tickets sold at the 5 schools arranged in ascending order, x are: 150, 200, 250, 275, 300

$ \Sigma x = 150 + 200 + 250 + 275 + 300 = 1175 \\[3ex] n = 5 \\[3ex] Mean = \dfrac{\Sigma x}{n} \\[5ex] = \dfrac{1175}{5} \\[5ex] = 235 \\[3ex] Median = middle\;\;number\;\;of\;\;sorted\;\;data = 250 \\[3ex] $ Difference between the median and the mean number of tickets sold at the 5 schools
= Median − Mean
= 250 − 235
= 15
(69.) ACT Andre's Floral Shop acked each of 20 customers to give a rating of the shop's service.
The table below summarizes the 20 customer ratings.

Rating Number of customers
3
2
1
0
6
8
2
4

Which of the following values is closest to the mean of the 20 customer ratings?

$ A.\;\; 1.8 \\[3ex] B.\;\; 2.0 \\[3ex] C.\;\; 2.3 \\[3ex] D.\;\; 2.7 \\[3ex] E.\;\; 3.3 \\[3ex] $

Rating, x Number of customers, f f * x
3
2
1
0
6
8
2
4
3 * 6 = 18
2 * 8 = 16
1 * 2 = 2
0 * 4 = 0
Σf = 20 Σfx = 36

$ Mean = \dfrac{\Sigma fx}{\Sigma f} \\[5ex] = \dfrac{36}{20} \\[5ex] = 1.8 $
(70.) ACT There are 2 sections of Algebra I taught at the local high school.
The average score on the final exam for the 20 students in the first section was 74.
The average score on the final exam for the 25 students in the second section was 92.
What was the average of the final exam scores of students in Algebra I?

$ A.\;\; 74 \\[3ex] B.\;\; 78 \\[3ex] C.\;\; 83 \\[3ex] D.\;\; 84 \\[3ex] E.\;\; 92 \\[3ex] $

The average of the final exam scores of students in Algebra I is the average of the final exam scores of students in both sections of Algebra I.
Students taking:
Algebra I is the population
First section of Algebra I is a sample
Section section of Algebra I is another sample

$ \underline{First\;\;Section\;\;of\;\;Algebra\;I} \\[3ex] \bar{x} = 74 \\[3ex] n = 20 \\[3ex] \Sigma x = 74(20) = 1480 \\[3ex] \underline{Second\;\;Section\;\;of\;\;Algebra\;I} \\[3ex] \bar{x} = 92 \\[3ex] n = 25 \\[3ex] \Sigma x = 92(25) = 2300 \\[3ex] \underline{Algebra\;I\;(Both\;\;Sections)} \\[3ex] n = 20 + 25 = 45 \\[3ex] \Sigma x = 1480 + 2300 = 3780 \\[3ex] \bar{x} = ? \\[3ex] \bar{x} = \dfrac{\Sigma x}{n} \\[5ex] = \dfrac{3780}{45} \\[5ex] = 84 $
(71.)

Check to make sure the grouped data has equal class intervals.
In other words, the class size must be the same for all the classes.
$AM = 13$

Age (in years), $x$ Number of people, $f$ $x_{mid} = \dfrac{LCI + UCI}{2}$ $D = x_{mid} - AM$ $f * D$
$1 - 5$ $18$ $\dfrac{1 + 5}{2} = \dfrac{6}{2} = 3$ $3 - 13 = -10$ $18(-10) = -180$
$6 - 10$ $12$ $\dfrac{6 + 10}{2} = \dfrac{16}{2} = 8$ $8 - 13 = -5$ $12(-5) = -60$
$11 - 15$ $25$ $\dfrac{11 + 15}{2} = \dfrac{26}{2} = 13$ $13 - 13 = 0$ $25(0) = 0$
$16 - 20$ $15$ $\dfrac{16 + 20}{2} = \dfrac{36}{2} = 18$ $18 - 13 = 5$ $15(5) = 75$
$21 - 25$ $20$ $\dfrac{21 + 25}{2} = \dfrac{46}{2} = 23$ $23 - 13 = 10$ $20(10) = 200$
$26 - 30$ $10$ $\dfrac{26 + 30}{2} = \dfrac{56}{2} = 28$ $28 - 13 = 15$ $10(15) = 150$
$\Sigma f = 100$ $\Sigma fD = 185$

$ \bar{x} = AM + \dfrac{\Sigma fD}{\Sigma f} \\[5ex] \bar{x} = 13 + \dfrac{185}{100} \\[5ex] \bar{x} = 13 + 1.85 \\[3ex] \bar{x} = 14.85 \\[3ex] Mean\:\:age = 14.85\;years $
(72.) WASSCE-FM The table shows the age distribution in years of a group of people.

Age (in years) $1 - 5$ $6 - 10$ $11 - 15$ $16 - 20$ $21 - 25$ $26 - 30$
Number of people $18$ $12$ $25$ $15$ $20$ $10$

Using an assumed mean (AM) of $13$ years, find the mean age of the people.


Check to make sure the grouped data has equal class intervals.
In other words, the class size must be the same for all the classes.
$AM = 13$

Age (in years), $x$ Number of people, $f$ $x_{mid} = \dfrac{LCI + UCI}{2}$ $D = x_{mid} - AM$ $f * D$
$1 - 5$ $18$ $\dfrac{1 + 5}{2} = \dfrac{6}{2} = 3$ $3 - 13 = -10$ $18(-10) = -180$
$6 - 10$ $12$ $\dfrac{6 + 10}{2} = \dfrac{16}{2} = 8$ $8 - 13 = -5$ $12(-5) = -60$
$11 - 15$ $25$ $\dfrac{11 + 15}{2} = \dfrac{26}{2} = 13$ $13 - 13 = 0$ $25(0) = 0$
$16 - 20$ $15$ $\dfrac{16 + 20}{2} = \dfrac{36}{2} = 18$ $18 - 13 = 5$ $15(5) = 75$
$21 - 25$ $20$ $\dfrac{21 + 25}{2} = \dfrac{46}{2} = 23$ $23 - 13 = 10$ $20(10) = 200$
$26 - 30$ $10$ $\dfrac{26 + 30}{2} = \dfrac{56}{2} = 28$ $28 - 13 = 15$ $10(15) = 150$
$\Sigma f = 100$ $\Sigma fD = 185$

$ \bar{x} = AM + \dfrac{\Sigma fD}{\Sigma f} \\[5ex] \bar{x} = 13 + \dfrac{185}{100} \\[5ex] \bar{x} = 13 + 1.85 \\[3ex] \bar{x} = 14.85 \\[3ex] Mean\:\:age = 14.85\;years $
(73.) ACT A new band asked its audience to rate the band’s performance on a scale from 1 (poor) through 5 (excellent).
The table below gives the percentage of the audience that gave each of the ratings.
To the nearest 0.1, what was the mean rating given by this audience?

Rating Percentage
1
2
3
4
5
0%
0%
10%
70%
20%

$ A.\;\; 2.0 \\[3ex] B.\;\; 2.8 \\[3ex] C.\;\; 3.0 \\[3ex] D.\;\; 4.0 \\[3ex] E.\;\; 4.1 \\[3ex] $

Assume the sample size of audience is 100
This implies the frequency is the number without the percentage

Assume n = 100
Rating, x Percentage Frequency, f f * x
1
2
3
4
5
0%
0%
10%
70%
20%
0
0
10
70
20
0
0
30
280
100
Σ f = 100 Σ fx = 410

$ Mean\;\;rating = \dfrac{\Sigma fx}{\Sigma f} \\[5ex] = \dfrac{410}{100} \\[5ex] = 4.1 $
(74.) ACT The average weight of Juan, Jim, and Malik is exactly 160 pounds.
The average weight of Juan, Jim, Malik, and Harry is exactly 150 pounds.
How many pounds does Harry weigh?

$ A.\;\; 100 \\[3ex] B.\;\; 120 \\[3ex] C.\;\; 130 \\[3ex] D.\;\; 155 \\[3ex] E.\;\; 190 \\[3ex] $

$ \underline{Juan,\;\;Jim,\;\;Malik} \\[3ex] n = 3 \\[3ex] \bar{x} = 160 \\[3ex] \Sigma x = \bar{x} * n \\[3ex] \Sigma x = 160(3) = 480 \\[5ex] \underline{Juan,\;\;Jim,\;\;Malik,\;\;Harry} \\[3ex] Let\;\;Harry's\;\;weight = x \\[3ex] n = 4 \\[3ex] \bar{x} = 150 \\[3ex] \Sigma x = 480 + x \\[3ex] \Sigma x = \bar{x} * n \\[3ex] 480 + x = 150(4) \\[3ex] 480 + x = 600 \\[3ex] x = 600 - 480 \\[3ex] x = 120 \\[3ex] $ Harry's weight is 120 pounds.
(75.) ACT A large theater complex surveyed 5,000 adults.
The results of the survey are shown in the tables below.

Age groups Number
21 – 30
31 – 40
41 – 50
51 or older
2,750
1,225
625
400

Moviegoer category Number
Very often
Often
Sometimes
Rarely
830
1,650
2,320
200

Tickets are $9.50 for all regular showings and $7.00 for matinees.

Based on the survey results, what was the average number of moviegoers for each of the 4 categories?

$ A.\:\: 610 \\[3ex] B.\:\: 1,060 \\[3ex] C.\:\: 1,240 \\[3ex] D.\:\: 1,250 \\[3ex] E.\:\: 1,985 \\[3ex] $

$ Average = Mean = \bar{x} \\[3ex] \bar{x} = \dfrac{\Sigma x}{n} \\[5ex] \Sigma x = 830 + 1650 + 2320 + 200 = 5000 \\[3ex] n = 4 \\[3ex] \bar{x} = \dfrac{5000}{4} \\[5ex] \bar{x} = 1250 \\[3ex] $ The average number of moviegoers for each of the $4$ categories is $1250$ moviegoers
(76.)

(77.)

(78.) ACT Mrs. Neeson, a science teacher, told her students that 30.0% of their final semester grades will come from their homework averages, and the remaining 70.0% will come from their test averages.
She also said that the final exam will count 20.0% of the test average.
What percent of the science final semester grade is the final exam grade?

$ A.\;\; 6.0\% \\[3ex] B.\;\; 10.5\% \\[3ex] C.\;\; 14.0\% \\[3ex] D.\;\; 20.0\% \\[3ex] E.\;\; 28.6\% \\[3ex] $

We do not know the final semester grade.
Let us assume it is 100

$ Homework\;\;averages = 30\%\;\;of\;\;100 \\[3ex] = 0.3(100) \\[3ex] = 30 \\[3ex] Test\;\;averages = 70\%\;\;of\;\;100 \\[3ex] = 0.7(100) \\[3ex] = 70 \\[3ex] Final\;\;exam = 20\%\;\;of\;\;70 \\[3ex] = 0.2(70) \\[3ex] = 14 \\[3ex] $ So, this is the question: what % of 100 is 14?
It is 14%
How?

$ \dfrac{is}{of} = \dfrac{\%}{100} ...Percent-Proportion \\[5ex] Let\;\;the\;\;\% = p \\[3ex] \dfrac{14}{100} = \dfrac{p}{100} \\[5ex] 14 = p \\[3ex] p = 14\% \\[3ex] $ Student: What if the final semester grade is another number besides 100?
Teacher: We shall still get the same answer.
I used 100 because it is much easier to work with.
What number would you like it to be?
Student: Assume it is 90
Teacher: Let us check out 90


Assume the final semester grade is 90

$ Homework\;\;averages = 30\%\;\;of\;\;90 \\[3ex] = 0.3(90) \\[3ex] = 27 \\[3ex] Test\;\;averages = 70\%\;\;of\;\;90 \\[3ex] = 0.7(90) \\[3ex] = 63 \\[3ex] Final\;\;exam = 20\%\;\;of\;\;63 \\[3ex] = 0.2(63) \\[3ex] = 12.6 \\[3ex] $ So, this is the question: what % of 90 is 12.6?

$ \dfrac{is}{of} = \dfrac{\%}{100} ...Percent-Proportion \\[5ex] Let\;\;the\;\;\% = p \\[3ex] \dfrac{12.6}{90} = \dfrac{p}{100} \\[5ex] 90(p) = 12.6(100) \\[3ex] p = \dfrac{12.6(100)}{90} \\[5ex] p = 14\% $
(79.)

(80.) ACT The mean of a list of 7 numbers is 85.
The first 6 numbers on the list are 82, 93, 68, 93, 70, and 98.
What is the 7th number on the list?

$ F.\;\; 83 \\[3ex] G.\;\; 84 \\[3ex] H.\;\; 90 \\[3ex] J.\;\; 91 \\[3ex] K.\;\; 93 \\[3ex] $

$ \underline{List\;\;of\;\;7\;\;numbers} \\[3ex] n = 7 \\[3ex] \bar{x} = 85 \\[3ex] \Sigma x = n * \bar{x} \\[3ex] = 7 * 85 \\[3ex] = 595 \\[3ex] \underline{List\;\;of\;\;6\;\;numbers} \\[3ex] n = 6 \\[3ex] x = 82, 93, 68, 93, 70, 98 \\[3ex] \Sigma x = 82 + 93 + 68 + 93 + 70 + 98 = 504 \\[3ex] \underline{To\;\;find\;\;the\;\;7th\;\;number} \\[3ex] \Sigma x \;\;of\;\;6\;\;numbers + 7th\;\;number = \Sigma x\;\;of\;\;7\;\;numbers \\[3ex] 504 + 7th\;\;number = 595 \\[3ex] 7th\;\;number = 595 - 504 \\[3ex] 7th\;\;number = 91 $


Top


(81.)

(82.) ACT All 25 students in a chemistry class took a test.
Each student earned a test score that was an integer number of points, and no 2 students earned the same test score.
The median test score was 80 points.
How many students earned a test score that was greater than 80 points?

$ A.\;\; 5 \\[3ex] B.\;\; 12 \\[3ex] C.\;\; 13 \\[3ex] D.\;\; 14 \\[3ex] E.\;\; 20 \\[3ex] $

sample size = 25
Odd sample data
Means that the median is the 13th test score
There are 12 test scores before, then the 13th test score (median), and then 12 test scores after
No 2 test scores are the same
Median = 80
This implies that 12 test scores are greater than 80 points.
(83.) ACT Sani's course grade in his chemistry class is based on 3 tests and 1 final exam.
Each of the 3 test scores is weighted as 20% of the course grade, and the final exam score is weighted as 40% of the course grade.
Sani's 3 test scores are 78, 86, and 82, respectively.
What is the minimum score that Sani will have to earn on the final exam in order to receive a course grade of at least 86?

$ F.\;\; 82 \\[3ex] G.\;\; 84 \\[3ex] H.\;\; 90 \\[3ex] J.\;\; 92 \\[3ex] K.\;\; 98 \\[3ex] $

Let that minimum score be: $p$
Let us represent this information in a table
You may do it any way you prefer.

Assessment Weight (%) Score Weighted Score
Test 1 20 78 1560
Test 2 20 86 1720
Test 3 20 82 1640
Final Exam 40 $p$ $40p$
$\Sigma Weights = 100$ $\Sigma Weighted\;\;Scores = 4920 + 40p$

$ \dfrac{\Sigma Weighted\;\;Scores}{\Sigma Weights} = Course\;\;Grade \\[5ex] At\;\;least\;\;86 \;\;means\;\; \ge 86 \\[3ex] \implies \\[3ex] \dfrac{4920 + 40p}{100} \ge 86 \\[5ex] 4920 + 40p \ge 86(100) \\[3ex] 4920 + 40p \ge 8600 \\[3ex] 40p \ge 8600 - 4920 \\[3ex] 40p \ge 3680 \\[3ex] p \ge \dfrac{3680}{40} \\[5ex] p \ge 92 \\[3ex] $ Sani will have to earn 92% on the final exam in order to receive a course grade of at least 86.
(84.) ACT For which of the following data sets is the difference between the mean and the median the greatest?

$ A.\;\; \{10, 10, 10, 10\} \\[3ex] B.\;\; \{10, 10, 15, 20\} \\[3ex] C.\;\; \{10, 15, 15, 15\} \\[3ex] D.\;\; \{10, 15, 15, 100\} \\[3ex] E.\;\; \{10, 20, 90, 100\} \\[3ex] $

The data sets are already arranged in ascending order.

$ \underline{Dataset\;\;A} \\[3ex] \{10, 10, 10, 10\} \\[3ex] n = 4 \\[3ex] \Sigma x = 10 + 10 + 10 + 10 = 40 \\[3ex] Mean = \dfrac{40}{4} = 10 \\[5ex] Median = \dfrac{10 + 10}{2} = \dfrac{20}{2} = 10 \\[5ex] Mean - Median = 10 - 10 = 0 \\[5ex] \underline{Dataset\;\;B} \\[3ex] \{10, 10, 15, 20\} \\[3ex] n = 4 \\[3ex] \Sigma x = 10 + 10 + 15 + 20 = 55 \\[3ex] Mean = \dfrac{55}{4} = 13.75 \\[5ex] Median = \dfrac{10 + 15}{2} = \dfrac{25}{2} = 12.5 \\[5ex] Mean - Median = 13.75 - 12.5 = 1.25 \\[5ex] \underline{Dataset\;\;C} \\[3ex] \{10, 15, 15, 15\} \\[3ex] n = 4 \\[3ex] \Sigma x = 10 + 15 + 15 + 15 = 55 \\[3ex] Mean = \dfrac{55}{4} = 13.75 \\[5ex] Median = \dfrac{15 + 15}{2} = \dfrac{30}{2} = 15 \\[5ex] Mean - Median = 13.75 - 15 = -1.25 \\[5ex] \underline{Dataset\;\;D} \\[3ex] \{10, 15, 15, 100\} \\[3ex] n = 4 \\[3ex] \Sigma x = 10 + 15 + 15 + 100 = 140 \\[3ex] Mean = \dfrac{140}{4} = 35 \\[5ex] Median = \dfrac{15 + 15}{2} = \dfrac{30}{2} = 15 \\[5ex] Mean - Median = 35 - 15 = 20 \\[5ex] \underline{Dataset\;\;E} \\[3ex] \{10, 20, 90, 100\} \\[3ex] n = 4 \\[3ex] \Sigma x = 10 + 20 + 90 + 100 = 220 \\[3ex] Mean = \dfrac{220}{4} = 55 \\[5ex] Median = \dfrac{20 + 90}{2} = \dfrac{110}{2} = 55 \\[5ex] Mean - Median = 55 - 55 = 0 \\[5ex] 20 \gt 1.25 \gt 0 \gt -1.25 \\[3ex] $ The difference between the mean and the median is greatest in Dataset D
(85.)

(86.) ACT Renata took 9 quizzes in German class.
Her scores, in order, were 6, 7, 7, 6, 8, 7, 8, 10, and 9.
She discovered a scoring error on the 9th quiz, and her score on that quiz was corrected to 10.
Which of the following measures of central tendency changed as a result of the correction?
I. Mean
II. Median
III. Mode

F. I only
G. II only
H. I and II only
J. II and III only
K. I, II, and III


A quick visual inspection show that only the mean will change as a result of the correction.
So, I'll go with Option F. I only

Student: May you show your work?
Teacher: Sure.


$ \underline{Initial\;\;Dataset} \\[3ex] 6, 7, 7, 6, 8, 7, 8, 10, 9 \\[3ex] Sorted\;\;dataset = 6, 6, 7, 7, 7, 8, 8, 9, 10 \\[3ex] n = 9 \\[3ex] \Sigma x = 6 + 6 + 7 + 7 + 7 + 8 + 8 + 9 + 10 = 68 \\[3ex] \bar{x} = \dfrac{\Sigma x}{n} = \dfrac{68}{9} = 7.5555556 \\[5ex] Odd\;\;sample\;\;size \\[3ex] \tilde{x} = 5th\;\;score = 7 \\[3ex] \widehat{x} = 7 \\[5ex] \underline{Corrected\;\;Dataset} \\[3ex] 6, 7, 7, 6, 8, 7, 8, 10, 10 \\[3ex] Sorted\;\;corrected\;\;dataset = 6, 6, 7, 7, 7, 8, 8, 10, 10 \\[3ex] n = 9 \\[3ex] \Sigma x = 68 + 1 = 69 \\[3ex] \bar{x} = \dfrac{\Sigma x}{n} = \dfrac{69}{9} = 7.66666667 \\[5ex] Odd\;\;sample\;\;size \\[3ex] \tilde{x} = 5th\;\;score = 7 \\[3ex] \widehat{x} = 7 \\[3ex] $ Only the mean changed.
(87.)

(88.) ACT In a data set of 10 distinct values, the single largest value is replaced with a much greater value to form a new data set.
Which of the following statements is true about the values of the mean and median for the new data set as compared to the mean and median of the original data set?

F. The mean will increase; the median will stay the same.
G. The mean will stay the same; the median will increase.
H. The mean and median will both stay the same.
J. The mean and median will both increase.
K. Using the given information, the means and medians of the 2 data sets cannot be compared.


Dataset has 10 values, so sample size is 10
So, we arrange the dataset in ascending order
The largest value will be the last value (the 10th value).
Replace that last value with a much greater value.
The median stays the same...of course because the median in this case is the average of the 5th and 6th values (which are not affected).
But the mean will change...it will increase because the sum of the values increases and you are dividing that sum by the same number of values (10)
Say the sum of the original dataset is 50. The mean is 5 (50 divided by 10)
Say the sum of the new dataset is 90. The mean is 9. (90 divided by 10)
So, the mean wil increase while the median stays the same.
F. The mean will increase; the median will stay the same.
(89.)

(90.) ACT Data Set A consists of the 8 numbers listed below.
Data Set B consists of the 8 numbers in A and a 9th number, which is greater than 90.
How will the mean and the median of B compare to the mean and the median 0f A? $$ 62, 76, 76, 80, 82, 87, 94, 96 $$ A. The mean and the median of B will each be greater than the mean and the median of A.
B. The mean and the median of B will each be less than the mean and the median of A.
C. The mean and the median of B will each be the same as the mean and the median of A.
D. The mean of B will be the same as the mean of A, and the median of B will be greater than the median of A.
E. The mean of B will be greater than the mean of A, and the median of B will be the same as the median of A.


Data Set A: 62, 76, 76, 80, 82, 87, 94, 96
The data set is sorted in ascending order.
Data Set B contains Data Set A and a 9th number greater than 90
The 9th number in Data Set B is a high number (greater than 90 considering the other data values).
Because it is a high number, the mean of Data Set B is greater than the mean of Data Set A.

The median of Data Set B is also greater than the median of Data Set A because 82 is greater than 81.

Hence: The mean and the median of B will each be greater than the mean and the median of A.

Student: May you show your work?
Teacher: Yes, let's do it.


Data Set A: 62, 76, 76, 80, 82, 87, 94, 96
Assume the 9th number in Data Set B to be 97 (97 > 90)
Assume Data Set B: 62, 76, 76, 80, 82, 87, 94, 96, 97

$ \underline{Data\;\;Set\;A} \\[3ex] 62, 76, 76, 80, 82, 87, 94, 96 \\[3ex] \Sigma x = 62 + 76 + 76 + 80 + 82 + 87 + 94 + 96 = 653 \\[3ex] n = 8 \\[3ex] \bar{x} = \dfrac{\Sigma x}{n} = \dfrac{653}{8} = 81.625 \\[5ex] \tilde{x} = \dfrac{80 + 82}{2} = \dfrac{162}{2} = 81 \\[5ex] \underline{Data\;\;Set\;B} \\[3ex] 62, 76, 76, 80, 82, 87, 94, 96, 97 \\[3ex] \Sigma x = 653 + 97 = 750 \\[3ex] n = 9 \\[3ex] \bar{x} = \dfrac{\Sigma x}{n} = \dfrac{750}{9} = 83.333 \\[5ex] \tilde{x} = 82 \\[5ex] 83.333 \gt 81.625 \\[3ex] 82 \gt 81 \\[3ex] $ The mean and the median of B will each be greater than the mean and the median of A.
(91.)

(92.)

(93.)

(94.) ACT The mean of the daily high temperatures for a 5-day period in a certain city was recorded as being 4.0°F.
It was later determined that the high temperature for 1 of these 5 days was recorded incorrectly.
If that day's high temperature was 2°F higher than originally recorded, what is the difference between the incorrectly recorded mean and the correct mean?

$ A.\;\; 0.4^\circ F \\[3ex] B.\;\; 1.2^\circ F \\[3ex] C.\;\; 2.0^\circ F \\[3ex] D.\;\; 4.0^\circ F \\[3ex] E.\;\; 4.4^\circ F \\[3ex] $

Because the ACT is a timed test, let us solve this question arithmetically by testing with numbers.

$ \underline{Initial\;\;Dataset} \\[3ex] Assume:\;\; 4, 4, 4, 4, 4 \\[3ex] n = 5 \\[3ex] \Sigma x = 4 + 4 + 4 + 4 + 4 = 4(5) = 20 \\[3ex] \bar{x} = \dfrac{\Sigma x}{n} = \dfrac{20}{5} = 4 \\[5ex] \underline{Corrected\;\;Dataset} \\[3ex] 2^\circ F\;\;higher \implies 2 + 4 = 6^\circ\;\;for\;\;1\;\;day \\[3ex] \implies \\[3ex] 4, 4, 4, 4, 6 \\[3ex] n = 5 \\[3ex] \Sigma x = 20 + 2 = 22 \\[3ex] \bar{x} = \dfrac{22}{5} = 4.4 \\[5ex] Difference\;\;between\;\;means = 4.4 - 4 = 0.4^\circ F \\[3ex] $ The difference between the incorrectly recorded mean and the correct mean is 0.4°F
(95.)

(96.)

(97.)

(98.) ACT The average of 10 test scores is x
When the highest score and lowest score are removed from the 10 scores, the average is y
Which of the following is an expression for the average of the highest score and lowest score?

$ F.\;\; 10x - 8y \\[3ex] G.\;\; \dfrac{x + y}{2} \\[5ex] H.\;\; \dfrac{10x + 8y}{2} \\[5ex] J.\;\; \dfrac{10x - 8y}{2} \\[5ex] K.\;\; \dfrac{10x + 8y}{18} \\[5ex] $

$ 10\;\;test\;\;scores \\[3ex] initial\;\;n = 10 \\[3ex] initial\;\;\bar{x} = x \\[3ex] initial\;\;\Sigma x = n * \bar{x} = 10x \\[5ex] highest\;\;score\;\;is\;\;removed \\[3ex] lowest\;\;score\;\;is\;\;removed \\[3ex] new\;\;n = 8 \\[3ex] new\;\;\bar{x} = y \\[3ex] new\;\;\Sigma x = new\;\;n * new\;\;\bar{x} = 8y \\[3ex] \implies \\[3ex] \Sigma x - highest\;\;score - lowest\;\;score = new\;\;\Sigma x \\[3ex] 10x - highest\;\;score - lowest\;\;score = 8y \\[3ex] 10x - 8y = highest\;\;score + lowest\;\;score \\[3ex] highest\;\;score + lowest\;\;score = 10x - 8y \\[3ex] Average\;\;of\;\;highest\;\;score\;\;and\;\;lowest\;\;score \\[3ex] = \dfrac{highest\;\;score + lowest\;\;score}{2} \\[5ex] = \dfrac{10x - 8y}{2} $
(99.)

(100.)


Top


(101.)

(102.)


Use the following information to answer Questions 103 – 105

ACT The whole number test scores of all 30 students in Ms. Smith's science class are represented in the cumulative frequency bar graph below.

Numbers 103-105


(103.) How many students in Ms. Smith's science class had a score greater than 70 on the test?

$ F.\;\; 13 \\[3ex] G.\;\; 17 \\[3ex] H.\;\; 18 \\[3ex] J.\;\; 20 \\[3ex] K.\;\; 72 \\[3ex] $

This is a cumulative frequency bar graph.
Let us draw the frequency table for this graph.
Be reminded that the number of students are cumulative frequencies, so we need to find the frequencies.

Student Test Scores Number of Students (Cumulative Frequencies) Frequencies, F
41 – 50 2 $2$
41 – 60 5 $5 - 2 = 3$
41 – 70 10 $10 - 5 = 5$
41 – 80 18 $18 - 10 = 8$
41 – 90 24 $24 - 18 = 6$
41 – 100 30 $30 - 24 = 6$
$\Sigma F = 30$

The number of students in Ms. Smith's science class had a score greater than 70 on the test is the sum of the frequencies of these classes: 41 – 80; 41 – 90; 41 – 100
= 8 + 6 + 6
= 20 students.
(104.) Which of the following intervals must contain the median score of the students' test scores in Ms. Smith's science class?

$ A.\;\; 56-65 \\[3ex] B.\;\; 61-70 \\[3ex] C.\;\; 66-75 \\[3ex] D.\;\; 71-80 \\[3ex] E.\;\; 76-85 \\[3ex] $

Let us draw another frequency table for the class intervals and the frequencies

Class Intervals Frequency, F
41 – 50 2
51 – 60 3
61 – 70 5
71 – 80 8
81 – 90 6
91 – 100 6
$\Sigma F = 30$

$ \dfrac{\Sigma F}{2} = \dfrac{30}{2} = 15 \\[5ex] 2 + 3 = 5 \\[3ex] 5 + 5 = 10 \\[3ex] 10 + 8 = 18...contains\;\;15...STOP \\[3ex] $ The class that contains 15 (or has 18 as the cumulative frequency) is 71 – 80
This is the class that the median score of the students' test scores in Ms. Smith's science class.
(105.) The students in Mr. Cho's class took the same test as those in Ms. Smith's class.
The number of students in Mr. Cho's class with a score in the range 41 – 50 was 3 less than 4 times the number of students in Ms. Smith's class with a score in the range 41 – 50.
How many students in Mr. Cho's class had a score in the range 41 – 50 on this test?

$ F.\;\; 5 \\[3ex] G.\;\; 4 \\[3ex] H.\;\; 3 \\[3ex] J.\;\; 2 \\[3ex] K.\;\; 1 \\[3ex] $

We need the frequency table from our response in Question (108.)
Number of students in Ms. Smith's class with a score in the range 41 – 50 = 2 (because the frequency for that class is 2)
Let the number of students in Mr. Cho's class with a score in the range 41 – 50 = p

$ 3\;\;less\;\;than\;\;4\;\;times\;\;2 = 4(2) - 3 \\[3ex] p = 4(2) - 3 \\[3ex] p = 8 - 3 \\[3ex] p = 5 \\[3ex] $ Number of students in Ms. Smith's class with a score in the range 41 – 50 = 5
(106.)

(107.)

(108.) ACT The mean of 10 numbers entered into a computer statistics program was 75.0.
One number was incorrectly entered as 73 instead of 78.
When the 73 is replaced by 78, by how much will the mean increase?

$ F.\;\; 0.1 \\[3ex] G.\;\; 0.5 \\[3ex] H.\;\; 1.5 \\[3ex] J.\;\; 3.0 \\[3ex] K.\;\; 5.0 \\[3ex] $

$ n = 10 \\[3ex] \bar{x} = 75 \\[3ex] \Sigma x = n * \bar{x} = 10(75) = 750 \\[3ex] $ One of the numbers is 73
Replacing 73 with 78 means adding 5 (78 - 73) to the sum of the data values
The sample size is still 10
This means that:

$ \Sigma x = 750 + 5 = 755 \\[3ex] n = 10 \\[3ex] \bar{x} = \dfrac{\Sigma x}{n} = \dfrac{755}{10} = 75.5 \\[5ex] Mean\;\;increased\;\;by:\;\; 75.5 - 75 = 0.5 $
(109.) ACT The graph below shows the distribution of a data set consisting of 16 positive integers.
Which of the following statements about the mean, median, and mode of the data set is true?

Number 109

A. The mode is less than the median, and the median is less than the mean.
B. The mode is less than the mean, and the mean is equal to the median.
C. The mode is equal to the mean, and the mean is less than the median.
D. The mean is less than the median, and the median is less than the mode.
E. The mean is equal to the median, and the median is equal to the mode.


Based on the shape of the histogram, the histogram is right-skewed because it has a tail on the right side of the distribution.
For right-skewed distributions, the mean is greater than the median, and the median is greater than the mode.
mean > median > mode
This is similar to saying that: The mode is less than the median, and the median is less than the mean.
mode < median < mean

Student: Can you prove it?
How did you know? How can you tell?
Teacher: If a distribution is right-skewed, then mean > median > mode
If a distribution is left-skewed, then mean < median < mode
If a distribution is normal, then mean = median = mode
We can definitely verify this question. Let's do it.


Integer, x Frequency, F Fx
1 1 1
2 3 6
3 4 12
4 3 12
5 2 10
6 1 6
7 1 7
8 1 8
ΣF = 16 Σ Fx = 62

$ \underline{Mean} \\[3ex] \bar{x} = \dfrac{\Sigma Fx}{\Sigma F} \\[5ex] = \dfrac{62}{16} \\[5ex] = 3.875 \\[5ex] \underline{Median} \\[3ex] \dfrac{\Sigma F}{2} = \dfrac{16}{2} = 8 \\[5ex] Adding\;\;from\;\;the\;\;top...STOP\;\;at\;\;4 \rightarrow x = 3 \\[3ex] Adding\;\;from\;\;the\;\;bottom...STOP\;\;at\;\;3 \rightarrow x = 4 \\[3ex] \tilde{x} = \dfrac{3 + 4}{2} \\[5ex] = 3.5 \\[5ex] \underline{Mode} \\[3ex] Highest\;\;Frequency = 4 \\[3ex] Mode = 3 \\[5ex] 3.875 \gt 3.5 \gt 3 \\[3ex] \therefore Mean \gt Median \gt Mode $
(110.)

(111.)

(112.) ACT Suppose a student's course grade is determined solely by that student's scores on 8 tests, which are worth 100 points each.
If Bane has an average of exactly 88 points on the first 6 tests, how many points must he average on the last 2 tests to earn exactly a 90-point course grade?

$ F.\;\; 99 \\[3ex] G.\;\; 96 \\[3ex] H.\;\; 95 \\[3ex] J.\;\; 94 \\[3ex] K.\;\; 92 \\[3ex] $

$ \underline{First\;\;6\;\;tests} \\[3ex] n = 6 \\[3ex] \bar{x} = 88 \\[3ex] \Sigma x = n * \bar{x} = 6 * 88 = 528 \\[3ex] \underline{Last\;\;2\;\;test} \\[3ex] n = 2 \\[3ex] Let\;\;\bar{x} = k \\[3ex] \Sigma x = n * \bar{x} = 2 * k = 2k \\[3ex] \underline{Student's\;\;course\;\;grade} \\[3ex] n = 8 \\[3ex] \bar{x} = 90 \\[3ex] \Sigma x = n * \bar{x} = 8 * 90 = 720 \\[3ex] $ The sum of: the scores on the first 6 tests and the scores on the last 2 tests is the total sum on the 8 tests.

$ \implies \\[3ex] 528 + 2k = 720 \\[3ex] 2k = 720 - 528 \\[3ex] 2k = 192 \\[3ex] k = \dfrac{192}{2} \\[5ex] k = 96 \\[3ex] $ Bane must average 96 points on the last 2 tests to earn exactly a 90-point course grade.
(113.)

(114.)

(115.) ACT Letter grades in Hugo's math class are based on the percent of the total possible points on 4 unit exams (each worth 100 points) and the final exam (worth 200 points) and are assigned according to the chart below.

Range Course grade
At least 90% A
80% – 89% B
70% – 79% C
60% – 69% D
Less than 60% F

The number of points Hugo scored on the unit exams this term were 82, 88, 91, and 83.
When course grades were posted, Hugo's course grade was listed as a B.
Which of the following could NOT have been the number of points he scored on the final exam?

$ F.\;\; 136 \\[3ex] G.\;\; 156 \\[3ex] H.\;\; 166 \\[3ex] J.\;\; 176 \\[3ex] K.\;\; 196 \\[3ex] $

4 unit exams @ 100 points each = 4(100) = 400
1 final exam @ 200 points = 1(200) = 200
∴ Total Possible Points = 400 + 200 = 600

Course grade is based on the percent of the total possible points
Hugo's course grade = B = 80% – 89%
Hugo's course grade is between:

$ 80\% \;\;of\;\; 600\;points \\[3ex] = \dfrac{80}{100} * 600 \\[5ex] = 80(6) \\[3ex] = 480\;points \\[3ex] and \\[3ex] 89\% \;\;of\;\; 600\;points \\[3ex] = \dfrac{89}{100} * 600 \\[5ex] = 89(6) \\[3ex] = 534\;points \\[3ex] $ Points already earned = 82 + 88 + 91 + 83 = 344
Points remaining is between: (480 − 344) and (534 − 344)
Points remaining is between: 136 and 190
Hugo's final exam score is between 136 and 190
Hugo could not have earned 196: Option K.
(116.)

(117.)

(118.)

(119.) ACT The list of numbers 41, 35, 30, X, Y, 15 has a median of 25.
The mode of the list of numbers is 15.
To the nearest whole number, what is the mean of the list?

$ A.\;\; 20 \\[3ex] B.\;\; 25 \\[3ex] C.\;\; 26 \\[3ex] D.\;\; 27 \\[3ex] E.\;\; 30 \\[3ex] $

For the numbers: 41, 35, 30, X, Y, 15
Mode = 15 means that either X or Y = 15
Assume X = 15
The median = 25
This means that when we arrange the numbers in ascending order, the average of the two middle numbers is 25
So, let us arrange the numbers in ascending order:
15, 15, Y, 30, 35, 41

$ \dfrac{Y + 30}{2} = 25 \\[5ex] Y + 30 = 2(25) \\[3ex] Y + 30 = 50 \\[3ex] Y = 50 - 30 \\[3ex] Y = 25 \\[3ex] The\;\;list\;\;of\;\;numbers\;\;is: \\[3ex] 15, 15, 20, 30, 35, 41 \\[3ex] sum = 15 + 15 + 20 + 30 + 35 + 41 = 156 \\[3ex] sample\;\;size = 6 \\[3ex] mean = \dfrac{sum}{sample\;\;size} \\[5ex] = \dfrac{156}{6} \\[5ex] = 26 $
(120.)


Top


(121.)

(122.)

(123.)

(124.) ACT Halle is bowling a series of 3 games.
She has bowled 2 of 3 games with scores of 148 and 176.
What score will Halle need to earn in her 3rd game to have an average score of 172 for the 3 games?

$ A.\;\; 165 \\[3ex] B.\;\; 172 \\[3ex] C.\;\; 182 \\[3ex] D.\;\; 192 \\[3ex] E.\;\; 200 \\[3ex] $

Let the score be x

$ \Sigma Scores = 148 + 176 + x = 324 + x \\[3ex] mean = 172 \\[3ex] n = 3 \\[3ex] \Sigma Scores = mean * n \\[3ex] 324 + x = 172 * 3 \\[3ex] 324 + x = 516 \\[3ex] x = 516 - 324 \\[3ex] x = 192 \\[3ex] $ Halle needs to earn a score of 192 in her 3rd game to have an average score of 172 for the 3 games.
(125.)

(126.)

(127.) The average of 5 distinct scores has the same value as the median of the 5 scores.
The sum of the 5 scores is 420.
What is the sum of the 4 scores that are NOT the median?

$ F.\;\; 315 \\[3ex] G.\;\; 320 \\[3ex] H.\;\; 336 \\[3ex] J.\;\; 350 \\[3ex] K.\;\; 360 \\[3ex] $

There are 5 numbers.
The numbers are distinct.
The sum of the numbers is 420.
The mean is equal to the median.

$ sum = 420 \\[3ex] n = 5 \\[3ex] mean = \dfrac{sum}{n} = \dfrac{420}{5} = 84 \\[5ex] mean = median = 84 \\[3ex] median = 84...middle\;\;number\;\;of\;\;dataset\;\;arranged\;\;in\;\;ascending\;\;order \\[3ex] \therefore the\;\;numbers\;\;are: \\[3ex] \{82, 83, 84, 85, 86\}...distinct\;\;numbers \\[3ex] sum = 82 + 83 + 84 + 85 + 86 = 420 \\[3ex] sum\;\;of\;\;the\;\;4\;\;scores\;\;that\;\;is\;\;not\;\;the\;\;median \\[3ex] = 82 + 83 + 85 + 86 \\[3ex] = 336 $
(128.)


(129.)

(130.)

(131.) ACT Pete has an average score of exactly x points on 4 equally weighted tests.
How many points higher than x must Pete score on the 5th equally weighted test to raise his average score after the 5th test to x + 2 points?

$ F.\;\; 2 \\[3ex] G.\;\; 4 \\[3ex] H.\;\; 5 \\[3ex] J.\;\; 8 \\[3ex] K.\;\; 10 \\[3ex] $

Let the 5th point = what

$ \Sigma points = mean * n \\[3ex] \underline{4\;\;equally\;\;weighted\;\;tests} \\[3ex] n = 4 \\[3ex] mean = x \\[3ex] \Sigma points = x * n \\[3ex] \Sigma points = nx \\[3ex] \underline{5\;\;equally\;\;weighted\;\;tests} \\[3ex] \Sigma points = nx + what \\[3ex] n = 5 \\[3ex] mean = x + 2 \\[3ex] \implies \\[3ex] nx + what = (x + 2) * 5 \\[3ex] what = 5(x + 2) - nx \\[3ex] what = 5x + 10 - 5x \\[3ex] what = 10 $ Pete must score 10 points on the 5th equally weighted test to raise his average score from x to x + 2
(132.)

(133.)

(134.)

(135.)

(136.)

(137.) ACT The mean of the set of 5 numbers {42, 3, 11, 27, x} is 24, and the median of the set of 4 numbers {53, 8, 29, y} is 38.
If it can be determined, which of the following values is equal to xy?
F. -38
G. -10
H. 10
J. 38
K. Cannot be determined from the given information


$ \underline{First\;\;Set} \\[3ex] \{42, 3, 11, 27, x\} \\[3ex] n = 5 \\[3ex] \Sigma numbers = 42 + 3 + 11 + 27 + x \\[3ex] \Sigma numbers = 83 + x \\[3ex] mean = 24 \\[3ex] \Sigma numbers = mean * n \\[3ex] \implies \\[3ex] 83 + x = 24(5) \\[3ex] 83 + x = 120 \\[3ex] x = 120 - 83 \\[3ex] x = 37 \\[3ex] \underline{Second\;\;Set} \\[3ex] \{53, 8, 29, y\} \\[3ex] Median = 38 \\[3ex] 1st\;\;Try: \\[3ex] \{y, 8, 29, 53\} \\[3ex] Median = \dfrac{8 + 29}{2} = \dfrac{37}{2} = 18.5 \\[5ex] 18.5 \ne 38 \\[3ex] 2nd\;\;Try: \\[3ex] \{8, 29, 53, y\} \\[3ex] Median = \dfrac{29 + 53}{2} = \dfrac{82}{2} = 41 \\[5ex] 41 \ne 38 \\[3ex] \implies \\[3ex] set = \{8, 29, y, 53\} \;\;\;OR\;\;\; \{8, y, 29, 53\} \\[3ex] whichever: \\[3ex] Median = \dfrac{29 + y}{2} = 38 \\[5ex] 29 + y = 2(38) \\[3ex] 29 + y = 76 \\[3ex] y = 76 - 29 \\[3ex] y = 47 \\[3ex] x - y \\[3ex] = 37 - 47 \\[3ex] = -10 $
(138.)

We can find the value of x from the first set.
However, we cannot find the value of y from the second set because the set is not ordered. Finding the median require that we arrange the data in descending order. Because the elements of the set are not arranged, we do not the ordered position of y in the set.
Hence, xy cannot be determined from the given information.
(139.)

(140.)


Top


(141.)

(142.)

(143.)

(144.)

(145.)

(146.)

(147.)

(148.)

(149.)

(150.)

(151.)

(152.)

(153.)

(154.)

(155.)

(156.)

(157.)

(158.)

(159.)

(160.)


Top


(161.) ACT The average of a list of 4 numbers is 90.0.
A new list of 4 numbers has the same first 3 numbers as the original list, but the fourth number in the original list is 80, and the fourth number in the new list is 96.
What is the average of this new list of numbers?

$ F.\;\; 90.0 \\[3ex] G.\;\; 91.5 \\[3ex] H.\;\; 94.0 \\[3ex] J.\;\; 94.5 \\[3ex] K.\;\; 94.8 \\[3ex] $ May you check out Number (61.)? Notice any similarities?


There are two lists of 4 numbers: original list and new list
The original list and the new list have 4 numbers. This means that the sample size for both lists = 4
The original list and the new list have the same first 3 numbers but different fourth numbers
This implies that the sum of the first 3 numbers in both lists is the same
Let us call the sum of the first 3 numbers as Σthree

$ \underline{Original\;\;List} \\[3ex] Mean = 90.0 = 90 \\[3ex] n = 4 \\[3ex] \Sigma x = \Sigma three + fourth\;\;number \\[3ex] \Sigma x = \Sigma three + 80 \\[3ex] Mean = \dfrac{\Sigma x}{n} \\[5ex] \implies \\[3ex] 90 = \dfrac{\Sigma three + 80}{4} \\[5ex] \Sigma three + 80 = 90(4) \\[3ex] \Sigma three + 80 = 360 \\[3ex] \Sigma three = 360 - 80 \\[3ex] \Sigma three = 280 \\[3ex] \underline{New\;\;List} \\[3ex] Mean = ?
n = 4 \\[3ex] \Sigma three = 280 \\[3ex] \Sigma x = \Sigma three + fourth\;\;number \\[3ex] \Sigma x = 280 + 96 \\[3ex] \Sigma x = 376 \\[3ex] Mean = \dfrac{\Sigma x}{n} \\[5ex] Mean = \dfrac{376}{4} \\[5ex] Mean = 94 = 94.0 $
(162.)

(163.)

(164.)